
Influencer marketing ROI: how to measure it beyond the discount code
How to measure influencer marketing ROI past the discount code: the formula, windows, refunds, repeat purchase, confidence tiers and a worked euro example.
To measure influencer marketing ROI, take the profit the campaign produced (attributed revenue net of VAT, discounts and refunds, times your gross margin) and subtract the full cost of the campaign: fees, commission, product, shipping, tools and team time. Divide the result by that cost. Then show how sure you are of each euro. A discount code is only one way to tie a sale to a creator, and usually the narrowest.
Most creator reports stop at the code. The brand counts the orders that used "LAURA15", divides by the fee, and calls it ROI. That number is too low in one way, because it misses everyone who clicked the link and paid full price. It is too high in another, because it counts VAT, refunded orders and buyers who would have bought anyway.
This guide walks through the formula, the five things it misses, a worked example for one 8-creator campaign in euros, a way to report honest ranges with confidence tiers, and a holdout test you can run without a data team.
What is the formula for influencer marketing ROI?
The base formula is the same as for any investment:
ROI = (return − cost) ÷ cost
For a creator campaign, both sides need a precise definition.
- Return is the contribution the campaign produced: attributed revenue × gross margin. Revenue alone is not return, because you still had to pay for the goods, the shipping and the payment fees.
- Cost is everything the campaign consumed: creator fees, commission paid on sales, gifted product at cost, shipping, any agency or platform fees, and the team hours you spent on it.
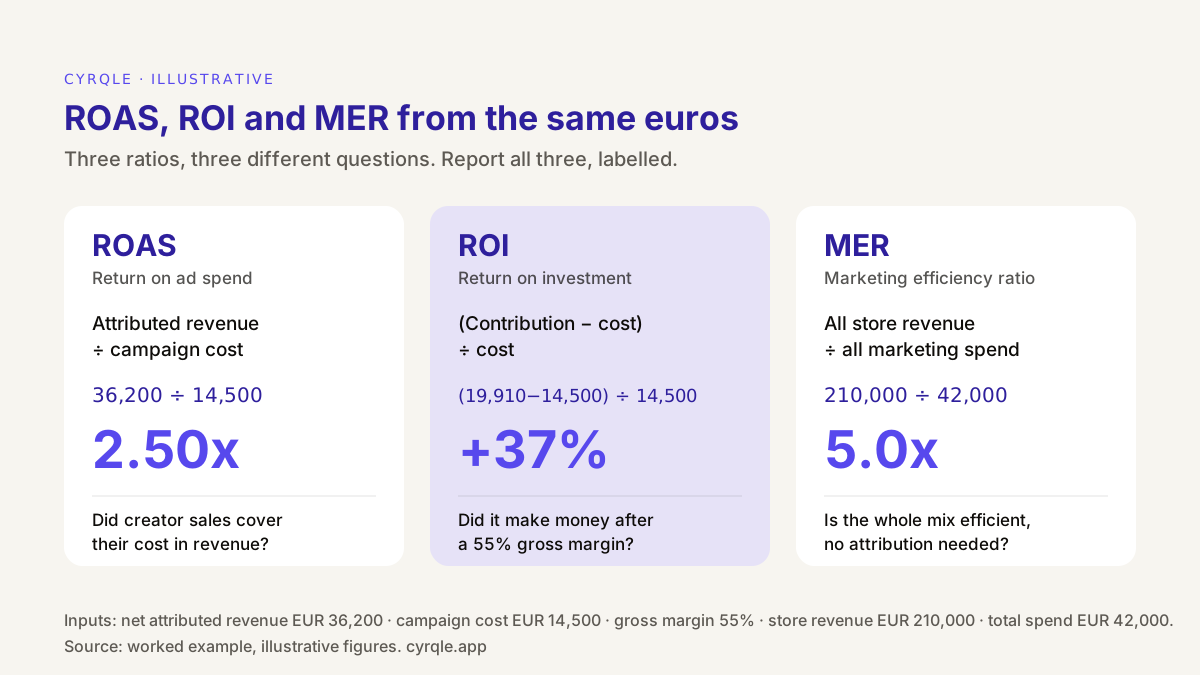
Three ratios get confused in creator reporting. They answer different questions, so report them side by side and label each one.
| Metric | Formula | Question it answers | Trap |
|---|---|---|---|
| ROAS | Attributed revenue ÷ campaign cost | Did creator sales cover their cost in revenue? | A ROAS above 1x can still lose money once margin is applied |
| ROI | (Contribution − cost) ÷ cost | Did the campaign make money? | Needs a margin figure that finance agrees with |
| MER | All store revenue ÷ all marketing spend | Is the whole marketing mix efficient? | Cannot tell you which creator worked |
A useful shortcut: the campaign breaks even when ROAS equals 1 ÷ gross margin. At a 55% margin, break-even ROAS is 1.82x. Anything below that loses money on the first order, even if the dashboard shows a healthy-looking ratio.
If you want a quick estimate before a campaign runs, the creator ROI calculator gives you attributed revenue, ROAS, ROI and cost per order from a few inputs. The rest of this guide is about measuring the real thing afterwards.
What does the discount-code number miss?
A code report is easy to produce and easy to defend. It also leaves out five things that move the result in both directions.
1. Buyers who clicked but did not use the code
Many buyers tap the creator's link, browse, and pay without typing a code. Some never saw the code. Some forgot it. A code-only report gives the creator no credit for those orders. A tracking link with a tag on your store catches them, as long as the buyer purchases in the same session or returns within your window.
2. The attribution window
An attribution window is how long after a click a purchase still counts for the creator. If your window is a single session, you miss the buyer who saw a reel on Sunday and bought on payday. If it is 90 days, you start crediting creators for sales that had other causes. State the window in every report. A 30-day window after the click is a common and defensible default for considered purchases such as skincare, fashion or electronics.
3. Refunds and returns
Revenue that comes back is not revenue. In Spain, a consumer who buys online has 14 calendar days from receiving the goods to withdraw without giving a reason, and the seller must refund within 14 calendar days of being told, though it may wait until the goods come back (Real Decreto Legislativo 1/2007, articles 104 and 107). Between the withdrawal period and the refund deadline, a refund can land up to four weeks or more after delivery, so allow about a month after the last attributed order before you call the number final. A report closed the day the last post goes live overstates revenue, and in fashion the gap can be large.
4. Repeat purchases
A creator who brings in a first-time customer often brings in their second and third order too. None of that sits inside a 30-day window. Track new customers from the campaign as a cohort and report their repeat revenue at 60 or 90 days as a separate line. Our piece on judging creators on cohort value, not CPA explains why this often changes which creator you rebook.
5. Content you can reuse
If your contract grants usage rights, the campaign also produced assets you can put on product pages, in email and, with a separate permission, in paid ads. That value is real but it is not revenue. Price it at what the same assets would have cost you to produce (your own last shoot, divided by the usable assets it gave you) and report it as cost avoided, on its own line.
And two things it counts that it should not
- VAT. Store dashboards often show order totals with VAT. VAT belongs to the tax authority, not to you. In Spain, the standard 21% IVA alone inflates revenue by about a fifth.
- Sales that would have happened anyway. A loyal customer who finds a creator code on a coupon site and uses it for a purchase they had already planned is attributed, but not incremental. The holdout section below shows how to estimate this.
A worked example: one 8-creator campaign in euros
All figures in this section are illustrative. A Spanish skincare brand runs a four-week launch with eight creators on Instagram and TikTok. Each creator gets a personal promo code (15% off) and a tracking link. The store runs a tag that records link clicks and checkout events. The attribution window is 30 days after the click.
Costs
| Cost line | Amount |
|---|---|
| Creator fees: 2 × EUR 2,500, 3 × EUR 1,200, 3 × EUR 600 | EUR 10,400 |
| Commission: 10% on net promo-code revenue | EUR 1,650 |
| Gifted product at cost, plus shipping, 8 kits | EUR 480 |
| Tools and team time allocated to the campaign | EUR 1,970 |
| Total campaign cost | EUR 14,500 |
Revenue, by how the sale was tied to a creator
All revenue is after the 15% discount and without VAT.
| Confidence tier | Orders | Revenue before refunds | Refunds | Net revenue |
|---|---|---|---|---|
| Promo code used at checkout | 260 | EUR 18,720 | EUR 2,220 | EUR 16,500 |
| Bought in the same session as the link click | 140 | EUR 9,800 | EUR 1,200 | EUR 8,600 |
| Clicked earlier, came back within 30 days | 180 | EUR 12,240 | EUR 1,140 | EUR 11,100 |
| Total | 580 | EUR 40,760 | EUR 4,560 | EUR 36,200 |
From the dashboard number to the honest number
Here is the same campaign, measured five ways. Each row fixes one mistake.
| Step | Revenue | Cost | ROAS |
|---|---|---|---|
| All tiers, VAT included, before refunds, fees only | EUR 49,320 | EUR 10,400 | 4.74x |
| Remove 21% VAT | EUR 40,760 | EUR 10,400 | 3.92x |
| Subtract refunds | EUR 36,200 | EUR 10,400 | 3.48x |
| Use full campaign cost | EUR 36,200 | EUR 14,500 | 2.50x |
| Count promo-code sales only | EUR 16,500 | EUR 14,500 | 1.14x |
The first row is the number that tends to end up in a slide. The fourth row is the most complete figure you can defend from attribution data. The fifth row is the floor.
ROI after margin
The brand's gross margin, after cost of goods, fulfilment and payment fees, is 55%.
- Contribution, all tiers: EUR 36,200 × 55% = EUR 19,910.
- ROI = (EUR 19,910 − EUR 14,500) ÷ EUR 14,500 = +37%.
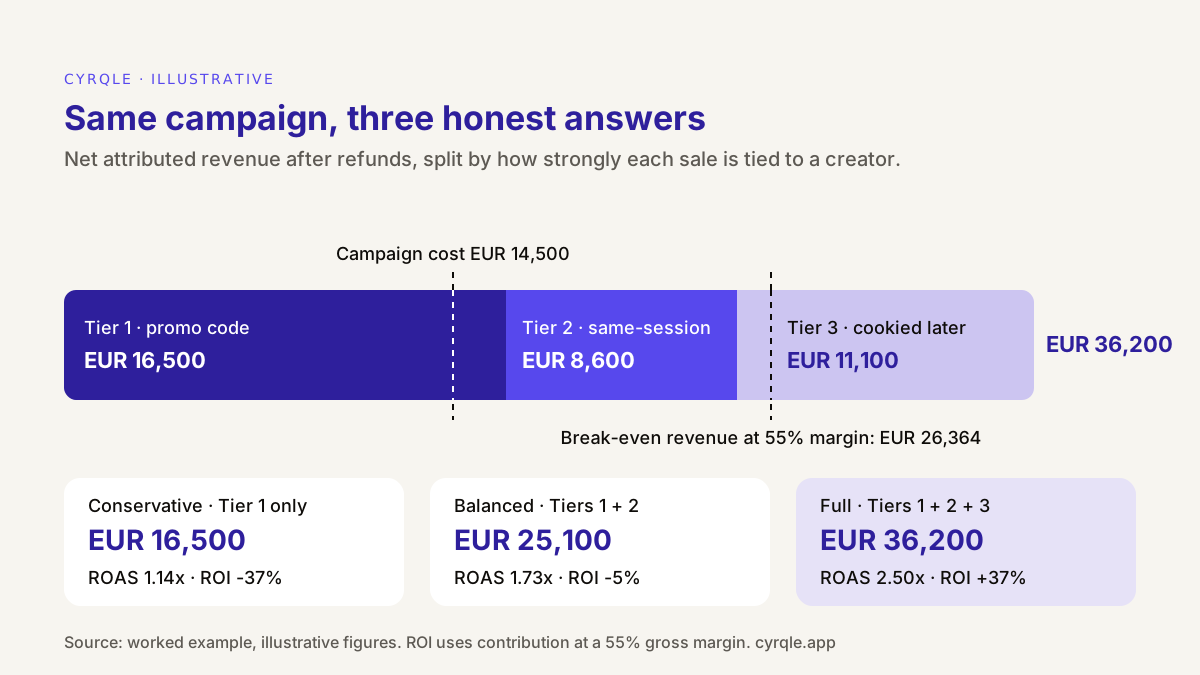
- Break-even revenue = EUR 14,500 ÷ 55% = EUR 26,364.
Now apply the same margin to each view of the data:
| View | Net revenue | ROAS | ROI after margin |
|---|---|---|---|
| Conservative: promo code only | EUR 16,500 | 1.14x | −37% |
| Balanced: code + same session | EUR 25,100 | 1.73x | −5% |
| Full: code + same session + returned within 30 days | EUR 36,200 | 2.50x | +37% |
The campaign is profitable only if you believe the buyers who came back later were brought by the creators. That is the honest finding. It is also a much more useful one than "ROAS 4.74x", because it tells you what evidence would settle the question.
The lines that sit outside the window
Two more numbers belong in the report, each on its own line.
- Repeat purchases at 90 days. 410 of the buyers were new customers. 18% of them (74 people) ordered again within 90 days, at EUR 62 per order on average: EUR 4,588 in revenue, EUR 2,523 in contribution. Including it moves full-view ROI from +37% to +55%. Report it later, when the 90 days have passed, and label it as cohort revenue.
- Content reuse value. The contracts licensed 10 of the 16 posts for the product pages. The brand's last studio shoot cost EUR 150 per usable asset, so that is EUR 1,500 of production cost avoided. It is an estimate, not cash, so keep it out of the ROI headline.
The MER cross-check
In the campaign month the store took EUR 210,000 (without VAT) on EUR 42,000 of total marketing spend, a MER of 5.0x. The month before, it took EUR 176,000 on EUR 27,500, a MER of 6.4x. Revenue rose by EUR 34,000 while spend rose by the campaign's EUR 14,500.
That is not proof of anything: season, stock and other channels changed too. But it is a useful ceiling. If attribution claims EUR 36,200 and the whole store grew by EUR 34,000, the full view is already at the top of what plausibly happened. That is another reason to report it as the upper end of a range.
How do you report creator ROI as an honest range?
Group every attributed sale by the strength of the evidence that links it to a creator. Three tiers cover most ecommerce campaigns.
| Tier | What proves it | What it misses or overstates | How to use it |
|---|---|---|---|
| Tier 1: promo code | The buyer typed the creator's code at checkout. The store records it | Misses link buyers who skip the code. Overstates when codes leak to coupon sites | The floor. The figure to pay commission on |
| Tier 2: same session | The buyer clicked the creator's link and bought in the same browsing session | Misses buyers who come back later or switch device | The middle. Strong evidence, deterministic match |
| Tier 3: cookied later | The buyer clicked earlier and returned within the window | Can credit sales that had other causes, such as an email or a search ad | The ceiling. Report it, label it, do not pay on it alone |
A report built this way reads like this:
Attributed net revenue EUR 16,500 to EUR 36,200 (promo code to 30-day return). ROAS 1.14x to 2.50x. ROI −37% to +37% at a 55% gross margin. Separate lines: EUR 4,588 repeat revenue from new customers at 90 days; EUR 1,500 content production cost avoided (estimate).
That paragraph survives a CFO's questions. A single "ROI 374%", which is what the first row of the table gives you if you read it as revenue over fees, does not. If finance wants one number, give them the balanced view and show the range beside it.
Three rules keep the tiers honest:
- Count each order once, at its strongest tier. If a buyer clicked the link and also used the code, it is a Tier 1 sale, not two sales.
- Fix the window before the campaign. Choose 7, 30 or 60 days in the brief, not after you see the results.
- Close the books after refunds settle. For a 30-day window, that means about a month after the window ends for the last post.
How do you prove the sales would not have happened anyway?
Attribution tells you which creator a sale followed. It does not tell you whether the sale was caused by the creator. The share of sales that would not have happened without the campaign is its incremental lift, and the standard way to measure it is a holdout test: you keep part of the market away from the campaign and compare.
You can run a basic geographic holdout yourself, with your own store data. Here is the method.
- Pick test and control regions. Choose regions with similar sales history over the last 8 to 12 weeks, for example two groups of Spanish provinces. Creators whose audience is concentrated in the test regions work best; ask each creator for a screenshot of their audience by city.
- Freeze everything else. No new paid campaigns, price changes or email pushes that hit only one group.
- Run the creators in the test regions only. Local creators, local codes, and offers that only ship or redeem in those regions.
- Compare growth. Expected test revenue = test revenue before × (control revenue during ÷ control revenue before). Incremental revenue = actual test revenue − expected test revenue.
Illustrative: test regions did EUR 80,000 in the four weeks before; control regions went from EUR 120,000 to EUR 126,000 (+5%). Expected test revenue is EUR 84,000. Actual test revenue is EUR 95,000. Incremental revenue is EUR 11,000. On a EUR 5,000 regional campaign, that is an incremental ROAS of 2.2x.
Be clear about the limits. Creator audiences do not stop at a provincial border, so some of the effect leaks into the control group and the test understates lift. Small brands may not have enough weekly orders per region for the difference to be more than noise. Run the test for at least four weeks, repeat it before you trust it, and report the result next to the attribution range, never instead of it.
What should you do with the number?
ROI is not the end of the report. It is the input to the next campaign. Rank creators by their balanced-view contribution per euro of cost, not by followers or views. Rebook the ones who clear break-even on Tier 1 and Tier 2 alone. Test the ones who only clear it with Tier 3 on a smaller budget, with a tighter offer. Drop the ones who miss it in every view.
That is why creator commerce works better as a loop than a funnel: the attribution data from this campaign decides the discovery and the budget of the next one. For the measurement side in more depth, including tracking surfaces and window choice, see our guide to first-party creator attribution.
How cyrqle helps
cyrqle gives each creator a promo code and a tracking link, and gives every sale a confidence tier. In Attribution, the tiers use the same labels as this guide: Tier 1 — promo code, Tier 2 — same-session and Tier 3 — cookied later, with a 30-day window for Tier 3. Each order counts once, at its strongest tier, and attributed revenue is shown net of refunds.
- Sources. A tag under 2KB on your own store ties link clicks to orders. On Shopify, a custom pixel covers hosted checkout. Signed order webhooks from Shopify, WooCommerce and Magento are the server-side record of each sale. For in-store sales, a cashier redemption page records codes without a store integration, and an operator can Record offline-attributed sale with a note.
- The Attribution tab. Sales, revenue and clicks by tier, top creators, content and markets, and an audit chain from each sale to the post, the code, the creator and the operator.
- The campaign report. An Attribution confidence dial switches between Conservative (Tier 1), Balanced (adds Tier 2) and Full (adds Tier 3), so you can show the range in a meeting instead of a single number.
- Exports. Reports gives you campaign, brand performance and creator reports as PDF or CSV, and agencies can white-label them for clients. Commission owed on sales is calculated and shown; paying it is a separate step.
What cyrqle does not do: it does not measure incrementality, run holdout tests or model media mix. The tiers tell you how strong the link between a sale and a creator is. The holdout test above is a method you run yourself, with your own store data. If you are comparing tools, our 12-point platform buyer's checklist covers the attribution questions to ask. To see the tiers on your own category, book a 30-minute demo.
More in this series
- Discount code vs tracking link vs pixel: which attribution method fits which campaign.
- A holdout test without a data team: the geographic test above, step by step.
- Returns-adjusted ROAS for fashion: when refunds are a third of revenue.
- How to justify a creator budget to your CFO: a one-page template for the range above.
- Influencer marketing KPIs by objective: what to report for awareness, traffic, sales and UGC.
- How to track creator sales on Shopify: codes, links, pixel and order webhooks.
- TikTok Shop vs your own store: where creator sales should land.
- Creator promo codes for Black Friday: naming, limits and leakage.
FAQ
What is a good ROI for influencer marketing?
Any ROI above zero after margin and full cost means the campaign made money on the first order. Be wary of a single benchmark: it depends on margin, category, price point and how much repeat revenue you count. Compare against your own paid channels on the same basis, with VAT and refunds removed.
Is ROAS the same as ROI?
No. ROAS is revenue divided by cost, so it ignores margin. ROI is profit divided by cost. A campaign with ROAS 1.5x loses money at a 55% gross margin, because break-even ROAS at that margin is 1.82x.
Which attribution window should I use for creators?
Choose it before the campaign and state it in the report. Thirty days after the click is a common default for considered purchases. Use a shorter window for impulse products and food delivery, and report repeat purchases separately instead of stretching the window.
Should I pay creator commission on all three tiers?
Most brands pay commission on promo-code sales, and sometimes same-session link sales, because both are deterministic. Sales from buyers who returned later are weaker evidence. If you include them, say so in the contract and use the same window you report on.
How long after a campaign should I report ROI?
Give a first read when the attribution window closes, and the final figure once refunds have settled, about a month later for online sales in Spain. Add 90-day repeat revenue as a later update, labelled as cohort revenue.
Can I measure ROI for awareness campaigns?
Not in sales terms with confidence. For awareness, report reach, views and effective cost per thousand views against your paid benchmark. If sales matter, run a holdout test, because awareness effects rarely show up in clicks or codes.
Sources
- Real Decreto Legislativo 1/2007, texto refundido de la Ley General para la Defensa de los Consumidores y Usuarios, articles 104 (withdrawal period) and 107 (refund deadline): https://www.boe.es/buscar/act.php?id=BOE-A-2007-20555
Related field notes.
Returns-adjusted ROAS for fashion creator campaigns: gross vs net ROAS per creator with worked numbers, why commission waits for returns, and who changes rank.
Run an influencer marketing incrementality test with a geo holdout: pick regions, size the test, then compute lift and a rough range in a spreadsheet.
How to tell whether the creator content on your site is earning its place. The metrics that matter at each step, from wall impressions to product clicks to attributed orders, and the traps that make the numbers look better or worse than they are.