
Influencer marketing KPIs by objective: awareness, traffic, sales and UGC
Influencer marketing KPIs for eight campaign objectives: one primary metric, one guardrail and the vanity number to drop, plus a free printable KPI sheet.
The right influencer marketing KPIs depend on the campaign objective. A sales campaign is judged on return on ad spend from net revenue; a traffic campaign on cost per site session; an awareness campaign on effective CPM against your paid-ads benchmark; a UGC campaign on cost per usable, rights-cleared asset. Each objective also needs a guardrail metric, and a vanity metric that you agree to leave out of the report.
Most creator reports fail in one of two ways. Either they show every number the platforms expose, so the reader cannot tell whether the campaign worked, or they show one flattering number that was never the goal. A beauty brand in Madrid that ran a launch for awareness gets judged on promo-code sales. A restaurant group in Valencia that wanted bookings gets a report full of likes.
This post gives you one KPI set per campaign objective, using the eight objective labels in the cyrqle campaign brief: Sales, Lead gen, Traffic, Free trial, Booking, UGC, Awareness and Engagement. Each set has a primary metric, a guardrail and the number not to report. You get a worked example for each family, a funnel that shows which KPI belongs at each step, and a printable sheet to fill in before launch. For the money side of sales campaigns in full, read the guide to measuring influencer marketing ROI past the discount code.
What makes a good influencer marketing KPI?
A good influencer marketing KPI measures the outcome the objective names, can be counted from data you control, and is agreed before the campaign starts. A key performance indicator is not any metric you can see: it is the one number that decides whether the campaign succeeded.
For each objective, set three things:
- Primary KPI. The number you judge the campaign on. One per objective. If you have three primary KPIs, you have none.
- Guardrail KPI. The number that tells you the primary KPI was not bought cheaply. A low cost per lead with no qualified leads, or a high ROAS that collapses after refunds, is a guardrail failure.
- Vanity metric to avoid. A number that is easy to make large and does not move the outcome. Agree in advance that it stays out of the headline. You can keep it in an appendix if a stakeholder insists.
Write the target next to each KPI, the data source (store orders, form tool, booking system, platform post data) and the time window. A KPI with no source and no window turns into an argument when the report lands.
The KPI sheet: eight objectives at a glance
The table below is the whole method on one page. Each objective section after it explains the choice and shows numbers.
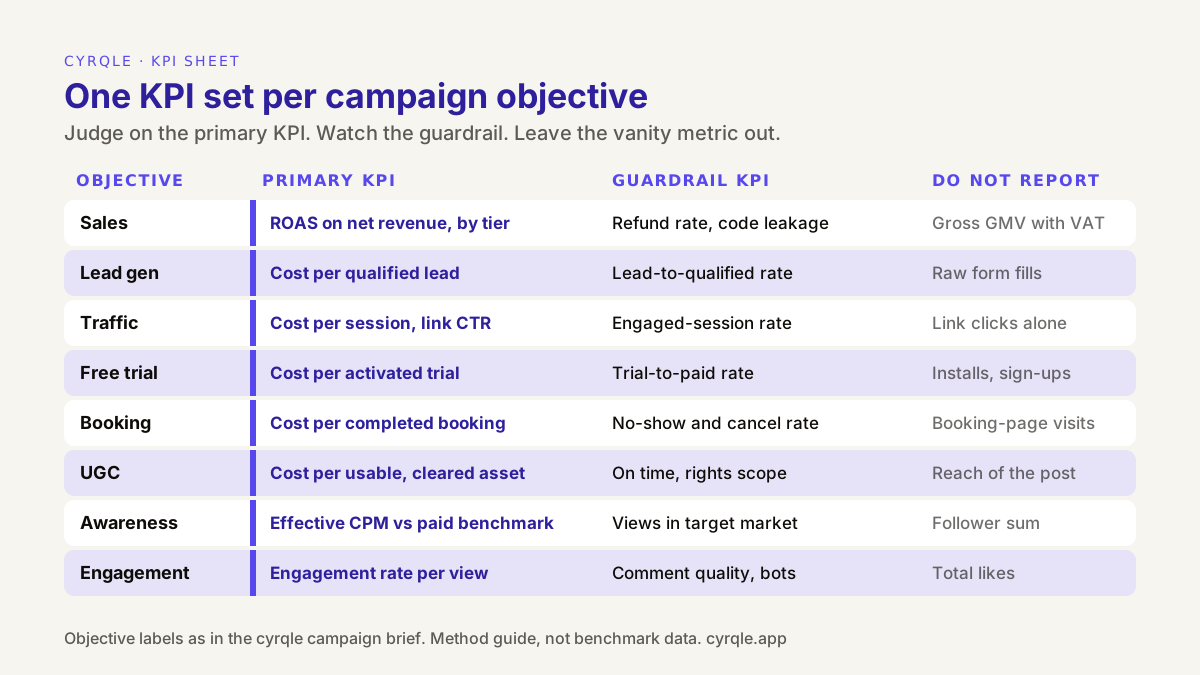
| Primary KPI | Guardrail KPI | Do not report as the result | |
|---|---|---|---|
| Sales | ROAS on net attributed revenue, by confidence tier | Refund rate; share of code orders that look like coupon-site leakage | Gross GMV with VAT; sum of code + link + pixel orders |
| Lead gen | Cost per qualified lead | Lead-to-qualified rate; duplicate rate | Raw form fills; link clicks |
| Traffic | Cost per site session; link click-through rate (clicks ÷ views) | Engaged-session rate on the landing page | Link clicks alone; impressions |
| Free trial | Cost per activated trial | Trial-to-paid rate | Installs or sign-ups that never activate |
| Booking | Cost per completed booking | No-show and cancellation rate | Visits to the booking page |
| UGC | Cost per usable asset with cleared rights | On-time delivery; rights scope matches planned use | Reach or media value of the creator's own post |
| Awareness | Effective CPM against your paid-ads benchmark | Share of views from the target market | Sum of creator followers ('potential reach') |
| Engagement | Engagement rate per view (comments, saves, shares) | Comment quality; no signs of bots or pods | Total likes |
Notice the pattern. Every primary KPI is a cost per outcome or a ratio, not a total. Totals grow with budget, so they tell you nothing about efficiency. Every vanity metric is a total that grows on its own.
Which KPIs fit an awareness campaign?
For awareness, the primary KPI is effective CPM: the creator fee divided by the views the posts delivered, times 1,000. Compare it with what you pay per thousand impressions for the same audience in paid social. The guardrail is the share of those views that came from your target market. The number not to report is the sum of the creators' followers.
Cost per thousand is the unit paid media already uses, so it is the only awareness number a media planner will accept next to a Meta or TikTok buy. Followers are not views: the case for pricing creators on views and CPM explains why follower counts mislead.
Worked example: six creators for a launch in Spain
All figures are illustrative.
| Line | Value |
|---|---|
| Creator fees, six creators, two reels each | EUR 9,000 |
| Views delivered in the first 7 days | 1,150,000 |
| Effective CPM, all views | EUR 9,000 ÷ 1,150,000 × 1,000 = EUR 7.83 |
| Share of views from Spain | 70% |
| Effective CPM, views in Spain only | EUR 9,000 ÷ 805,000 × 1,000 = EUR 11.18 |
| Your paid-social CPM for the same audience | EUR 6.50 |
On all views, the creators look close to paid social. On views in the market you sell to, they cost about 1.7 times more. That is not a fail by itself. The premium can be worth paying if the content is reusable, if comments show real interest, or if the creators reach people your ads do not. But the report should show the EUR 11.18, not the EUR 7.83. Ask each creator for a screenshot of the post's audience-location insights so you can work out the share of views from your market.
Two cautions. First, a creator "view" and a paid "impression" are not the same unit. Instagram moved to views as the main metric across Reels, Stories, photos and carousels in 2024, counting a view when content starts playing or appears on screen, as reported by Tubefilter. Your ad CPM counts impressions under the ad platform's own rules. Compare them as a guide, not to the cent. Second, if awareness is the real goal and the budget is large, measure it directly with a brand-lift survey or a holdout test run by your own team. Effective CPM tells you what reach cost, not what it changed.
Which KPIs fit an engagement campaign?
For engagement, the primary KPI is engagement rate per view: comments, saves and shares divided by views. Use views, not followers, as the denominator, for the same reason as above. The guardrail is comment quality: read a sample. Generic one-word comments, repeated emoji strings and the same accounts on every post point to engagement pods or bought interaction. The vanity metric is total likes.
Weight the interactions that cost the viewer effort. A save or a share means someone wants to come back or show a friend. A like costs one tap. If you must give one number, report comments, saves and shares per 1,000 views, and keep likes as a separate line.
Which KPIs fit a traffic campaign?
For traffic, the primary KPI is cost per site session, with link click-through rate (link clicks divided by views) beside it. The guardrail is the engaged-session rate on the landing page: sessions that lasted, scrolled or viewed a second page. The vanity metric is link clicks on their own.
Clicks and sessions are not the same number. Some clicks never load the page: the in-app browser closes, the visitor bounces before your tag runs, or a bot follows the link. Judge on the sessions your site analytics records, tagged with the creator's tracking link. A creator with a high click count and a low engaged-session rate sent curious thumbs, not interested visitors.
Which KPIs fit a sales campaign?
For sales, the primary KPI is ROAS on net attributed revenue, reported by confidence tier. Net means without VAT, after discounts and after refunds. The guardrails are the refund rate and code leakage: code orders that keep arriving weeks after the last post, at a steady rate, usually come from coupon sites. The vanity metrics are gross GMV with VAT, and any total made by adding code, link and pixel orders together, which counts the same order more than once.
Report a range, not a point. Promo-code orders are the floor. Orders from a click in the same session are the middle. Orders from buyers who clicked and came back later are the ceiling. The comparison of discount codes, tracking links and pixels shows how the three overlap and how to count each order once. If finance wants profit rather than revenue, add margin and use ROI, as the pillar guide above describes.
Which KPIs fit lead gen, free trial and booking campaigns?
These three objectives share one rule: judge the campaign on the cost per result that has value to you, not per form submitted. For Lead gen, that is cost per qualified lead. For Free trial, cost per activated trial, meaning the user did the first meaningful action. For Booking, cost per completed booking, meaning the guest arrived or the appointment took place.
The guardrails follow the same logic: lead-to-qualified rate, trial-to-paid rate, and no-show plus cancellation rate. The vanity metrics are the raw versions: form fills, installs, and visits to the booking page.
Worked example: two creators, one lead form
All figures are illustrative. A Spanish online language school pays each of two creators EUR 1,500 to drive sign-ups for a free level test.
| Creator A | Creator B | |
|---|---|---|
| Fee | EUR 1,500 | EUR 1,500 |
| Form fills | 300 | 180 |
| Cost per lead | EUR 5.00 | EUR 8.33 |
| Qualified by the sales team | 35% = 105 | 70% = 126 |
| Cost per qualified lead | EUR 14.29 | EUR 11.90 |
On raw leads, Creator A wins clearly. On qualified leads, Creator B is cheaper and delivered more of the people sales can use. Without the guardrail, you would rebook the wrong creator.
These outcomes live in your own form tool, product analytics or booking system, so agree before launch how each result is tagged with the creator's link or code, and who exports the counts.
Which KPIs fit a UGC campaign?
For a UGC campaign, the primary KPI is cost per usable asset with cleared rights: total fees divided by the pieces of content you approved and are licensed to use where you planned. The guardrails are on-time delivery and rights scope. The vanity metric is the reach or estimated media value of the creator's own post, because a UGC deal buys content, not distribution.
Illustrative example. You order 20 videos from five creators for EUR 6,000, a nominal EUR 300 per asset. Three arrive after the launch date, and one comes without paid-ads use in the licence. You can use 16 for the planned placements. Your real cost is EUR 6,000 ÷ 16 = EUR 375 per usable asset.
Rights scope is part of the KPI, not a footnote. An asset you may post organically but not run as an ad is worth less if ads were the plan. The worked calculator for usage rights and exclusivity covers how to price that difference. If the content goes onto your site, measure what it does there separately: the guide on measuring on-site UGC impact covers wall click-through and attributed revenue.
How do the KPIs connect from views to orders?
For a campaign that runs from reach to sales, each step of the funnel has its own KPI. Views are judged on effective CPM, clicks on click-through rate and cost per click, sessions on cost per session and engaged rate, and orders on conversion rate, cost per order and ROAS. Reading them in sequence tells you where the campaign leaks.
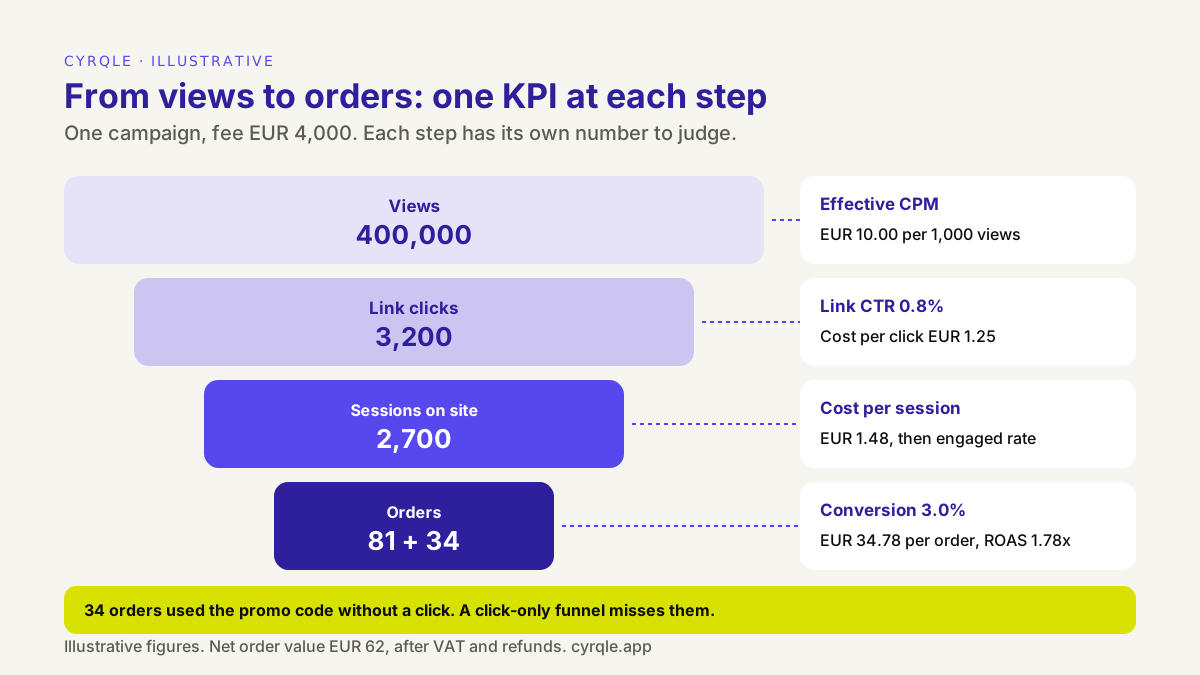
Worked through, with illustrative figures:
| Step | Count | KPI at this step |
|---|---|---|
| Views | 400,000 | Effective CPM = 4,000 ÷ 400,000 × 1,000 = EUR 10.00 |
| Link clicks | 3,200 | CTR = 3,200 ÷ 400,000 = 0.8%; cost per click EUR 1.25 |
| Sessions on site | 2,700 | Cost per session EUR 1.48; 84% of clicks became sessions |
| Orders from link sessions | 81 | Conversion rate = 81 ÷ 2,700 = 3.0% |
| Orders with the code, no click | 34 | Only the promo code sees these |
| All orders | 115 | Cost per order EUR 34.78; net revenue 115 × EUR 62 = EUR 7,130; ROAS 1.78x |
Two lessons. First, the funnel is not closed: 34 buyers typed the code without ever clicking, so a report built only on link data would show 81 orders and a ROAS of 1.26x. Second, a weak number at one step points to its cause. A low CTR with a normal conversion rate is a creative or call-to-action problem. A good CTR with a poor conversion rate is a landing page or offer problem. And at a 55% gross margin, break-even ROAS is 1 ÷ 0.55 = 1.82x, so this campaign is just under break-even on first orders. That is the guardrail doing its job.
How to fill in the KPI sheet before launch
Copy this table into your brief, or print this page, and fill one row per campaign before any creator is invited. The first row is a filled example.
| Objective | Primary KPI and target | Guardrail and threshold | Not reported | Data source | Window |
|---|---|---|---|---|---|
| Sales (example) | ROAS ≥ 2.0x on net revenue, Tier 1 + Tier 2 | Refund rate ≤ 15% | Gross GMV with VAT | Store orders via webhook | 30 days from last post |
Four rules for filling it in:
- One objective per campaign. If a launch needs both reach and sales, split the creators into two groups with their own briefs, or name one objective primary and report the other as context.
- Targets come from your own history or your paid channels, not from a generic benchmark. A target of "effective CPM within 1.5 times our paid-social CPM" is useful. "Engagement rate above 3%" copied from a blog is not.
- State the window. Seven days of views for awareness, 30 days after the click for most sales, the full trial length for free trials.
- Name the person who exports the numbers from systems the creator platform cannot see, such as your CRM or booking tool.
How cyrqle helps
In Campaigns, the brief starts with one of the eight objectives used in this post: Sales, Lead gen, Traffic, Free trial, Booking, UGC, Awareness or Engagement. The campaign performance strip then shows the metrics that fit that objective. A UGC campaign, for example, hides reach and media value and keeps delivery and engagement on the produced assets. Ranking in the discovery drawer uses the brief, including objective fit.
- Awareness and engagement. Published posts on Instagram and TikTok are tracked with views and engagement, with an effective CPM against a paid-ads benchmark. That is the awareness KPI in this post, per post and per creator.
- Traffic and sales. In Attribution, each creator gets a promo code and a tracking link, a tag under 2KB on your store ties clicks to orders, and signed order webhooks from Shopify, WooCommerce and Magento record each sale net of refunds. Every order carries one confidence tier: Tier 1 — promo code, Tier 2 — same-session or Tier 3 — cookied later (30-day window).
- UGC. Drafts can be approved or sent back, with an automated check for required hashtags and handles, and content-rights licences are kept on the Agreements page with their status.
- Reporting. Reports exports the Campaign report, Brand performance and creator reports as PDF or CSV, and agencies can white-label them. For ROAS by tier, use the campaign's Attribution tab.
What cyrqle does not do: it does not measure brand lift, incrementality or media mix, and it does not track posts on YouTube, X, LinkedIn or Facebook. For lead gen, free trial and booking, the qualified or completed result usually lives in your own CRM or booking system, so count it there against the creator's link or code. To see the objective-specific view on your own category, book a 30-minute demo.
FAQ
What are the most important influencer marketing KPIs?
The most important KPI is the one that matches your campaign objective: ROAS on net revenue for sales, cost per qualified lead for lead gen, cost per session for traffic, effective CPM for awareness, engagement rate per view for engagement and cost per usable asset for UGC. Pair each with one guardrail metric.
Is engagement rate a good KPI for influencer marketing?
Only for engagement campaigns, and only when calculated per view rather than per follower. For sales or traffic campaigns it is context, not a result: a post can collect thousands of comments and sell nothing. Check comment quality too, because bought or pod engagement inflates the rate.
How do I measure influencer awareness campaigns without sales data?
Use effective CPM: total creator fees divided by views delivered, times 1,000. Count only views from your target market, and compare the result with your paid-social CPM for the same audience. If the budget justifies it, add a brand-lift survey or a holdout test run by your team.
How many KPIs should one influencer campaign have?
Three per objective: one primary KPI you judge the campaign on, one guardrail and one agreed vanity metric to leave out. Other numbers can sit in an appendix. A campaign with five primary KPIs will always look successful on one of them, which means none of them decides anything.
What is a good effective CPM for creators?
There is no single good number; it depends on market, platform, format and category. Compare against your own paid-social CPM for the same audience. A creator premium above that is acceptable when the content is reusable, the audience is hard to reach with ads, or the creator also drives measurable sales.
Sources
- Tubefilter, "Views, views, views: Instagram standardizes its metrics to promote a multiformat approach", 7 August 2024, reporting Adam Mosseri's announcement: https://www.tubefilter.com/2024/08/07/instagram-views-reels-posts-multi-format-adam-mosseri/
Related field notes.
How to tell whether the creator content on your site is earning its place. The metrics that matter at each step, from wall impressions to product clicks to attributed orders, and the traps that make the numbers look better or worse than they are.
Returns-adjusted ROAS for fashion creator campaigns: gross vs net ROAS per creator with worked numbers, why commission waits for returns, and who changes rank.
TikTok Shop vs Shopify for creator sales in Spain: in-app conversion against customer data, margin, returns and attribution, with a worked example in euros.