
How to justify a creator budget to your CFO (one-page template)
Justify your influencer marketing budget on one page: spend, attributed revenue as a range, MER, payback, holdout result and risks, with a worked euro example.
To justify an influencer marketing budget to a CFO, show what the money returned in the language finance already uses: fully loaded cost, revenue net of refunds and VAT, margin, payback period and risk. Put it on one page. Show attributed revenue as a range, not a single ROAS, and add one result that does not depend on attribution, such as a holdout test or the change in your marketing efficiency ratio.
Q4 is when many brands set next year's budgets. The creator line is often one finance questions hard, because the evidence comes in a form they do not trust: screenshots, reach numbers and one big ROAS from a discount-code report. This guide gives you a one-page template, explains each block and what the CFO will ask about it, and fills it in with a worked example in euros. Every number in the example is illustrative.
What should a creator budget one-pager contain?
A creator budget one-pager contains eight blocks, in this order: the ask, spend, attributed revenue, ROAS against break-even, MER, payback, the holdout and content result, and risks with a stop rule. The order matters. The decision comes first and the evidence follows, so the CFO can read the top third and know what you want.
| Block | What goes in it | The CFO question it answers |
|---|---|---|
| 1. The ask | Amount, period, how it is split, how it is released | What exactly are you asking me to approve? |
| 2. Spend, fully loaded | Fees, commission paid, product and shipping, internal time and tools | What did the last budget really cost? |
| 3. Attributed revenue | Revenue tied to creators, net of refunds and VAT, by confidence tier and by creator size | How much revenue can you trace, and how sure are you? |
| 4. ROAS against break-even | ROAS for each view of the range, next to 1 ÷ gross margin | Did it make money, or only revenue? |
| 5. MER | Total revenue ÷ total marketing spend, before and after, and the marginal return | Did the whole business get more efficient? |
| 6. Payback | Months until cumulative gross margin covers cumulative spend | When do I get the money back? |
| 7. Holdout and content | Incremental result if you ran a test; licensed content you can reuse | Would those sales have happened anyway? What else did we get? |
| 8. Risks and stop rule | What could make the numbers wrong, and the metric that pauses spend | What happens if it stops working? |
Leave out the numbers that finance discounts on sight: follower totals, impressions presented as value, engagement rate, and media-value estimates. They can go in an appendix, labelled as estimates. If you need help choosing which metric belongs to which campaign goal, our guide to influencer KPIs for each campaign objective maps them.
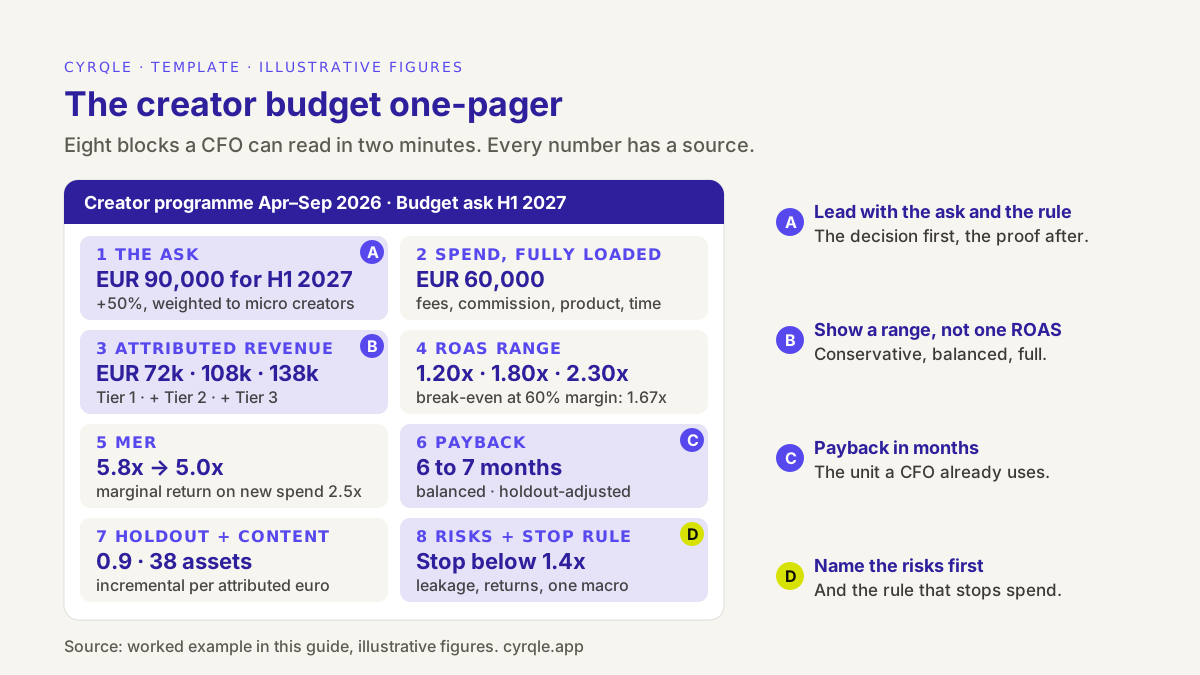
The one-page template
Copy this into a document or a single spreadsheet tab. Replace every bracket. If you cannot fill a line, write "not measured" rather than deleting it: a visible gap is more credible than a missing one.
CREATOR PROGRAMME: [period measured]  |  BUDGET ASK: [period requested]

1. THE ASK
   Amount: EUR [ ] for [period], released in [n] tranches
   Release rule: tranche 2 only if [metric] >= [value] by [date]
   Split: [% by creator size tier or market]

2. SPEND, FULLY LOADED (ex VAT)
   Creator fees EUR [ ] | Commission paid EUR [ ] | Product and shipping EUR [ ]
   Internal time and tools EUR [ ]  | TOTAL EUR [ ]

3. ATTRIBUTED REVENUE (net of refunds, ex VAT, [n]-day window)
   Conservative (promo code only): EUR [ ]
   Balanced (+ same-session link sales): EUR [ ]
   Full (+ returning clickers in window): EUR [ ]
   By creator size tier: see table

4. ROAS vs BREAK-EVEN
   ROAS: [ ]x / [ ]x / [ ]x   |  Gross margin [ ]%  ->  break-even ROAS [ ]x
   Contribution after spend: EUR [ ] / [ ] / [ ]

5. MER
   Same period last year: [ ]x  |  This period: [ ]x
   Marginal return on added spend: [ ]x

6. PAYBACK
   Balanced view: month [ ]  |  Holdout-adjusted: month [ ]  |  Conservative: [ ]

7. HOLDOUT AND CONTENT
   Holdout: [design, dates], incremental EUR [ ] (rough range [ ] to [ ])
   Incremental per attributed euro: [ ]
   Content licensed for reuse: [n] assets, est. avoided cost EUR [ ] (not in ROI)

8. RISKS AND STOP RULE
   [3 to 5 risks, one line each]
   Stop rule: pause new bookings if [metric] < [value] for [period]
Worked example: a skincare brand in Spain, April to September 2026
A Spanish D2C skincare brand ran an always-on creator programme from April to September 2026 with 37 creators on Instagram and TikTok. In October it asks for the first half of 2027. All figures in this example are illustrative.
Block 2: spend, fully loaded
Start with cost, because it is the number the CFO can check against the ledger. Include everything the programme consumed, not only creator fees. Our breakdown of the true cost of a creator collaboration lists the lines teams usually forget.
| Line | EUR, ex VAT |
|---|---|
| Creator fees | 38,000 |
| Commission paid (10% of promo-code revenue) | 7,200 |
| Product and shipping | 5,800 |
| Internal time and tools (share of one marketer, software) | 9,000 |
| Total, fully loaded | 60,000 |
Block 3: attributed revenue as a range
Group every attributed order by how strongly it is tied to a creator, and count each order once, at its strongest tier. The method is explained in our guide to measuring influencer ROI beyond the discount code. Revenue is net of refunds and VAT, with a 30-day window.
| View | What it counts | Attributed revenue | ROAS | Gross margin (60%) | Contribution after spend | ROI |
|---|---|---|---|---|---|---|
| Conservative | Promo-code orders only | EUR 72,000 | 1.20x | EUR 43,200 | −EUR 16,800 | −28% |
| Balanced | + orders in the same session as a creator link click | EUR 108,000 | 1.80x | EUR 64,800 | +EUR 4,800 | +8% |
| Full | + buyers who clicked earlier and returned within 30 days | EUR 138,000 | 2.30x | EUR 82,800 | +EUR 22,800 | +38% |
Lead with the balanced view and show the range beside it. A CFO who sees all three rows trusts the middle one. A CFO who sees only "2.30x" will discount it anyway, usually further than you would. If the codes leaked to coupon sites, say so: our comparison of discount codes, tracking links and pixels covers what each method over- and under-counts.
Block 3, continued: revenue by creator size tier
The second cut is by creator size, because it is where next year's money will move. Spend here is direct spend only (fees, commission and product), so the ROAS figures are higher than the programme figure.
| Creator tier (followers) | Creators | Direct spend | Attributed revenue, balanced | ROAS on direct spend |
|---|---|---|---|---|
| Nano (under 10k) | 14 | EUR 8,000 | EUR 16,000 | 2.00x |
| Micro (10k to 100k) | 18 | EUR 22,000 | EUR 52,000 | 2.36x |
| Mid (100k to 500k) | 4 | EUR 13,000 | EUR 27,000 | 2.08x |
| Macro (over 500k) | 1 | EUR 8,000 | EUR 13,000 | 1.63x |
| Total | 37 | EUR 51,000 | EUR 108,000 | 2.12x |
Micro creators returned the most per euro. The single macro creator returned the least and carries 16% of direct spend on one person, which is also a concentration risk. Both facts shape the ask.
Block 4: ROAS against break-even
Break-even ROAS is 1 divided by gross margin. At a 60% gross margin, break-even ROAS is 1 ÷ 0.60 = 1.67x. Any view of the range above 1.67x made money on the first order; any view below it did not. In this example the balanced view (1.80x) clears break-even, the full view clears it comfortably, and the conservative view (1.20x) does not. Write that sentence on the page. It answers "did it make money, or only revenue?" before the CFO asks.
Block 5: MER contribution
Marketing efficiency ratio (MER) is total store revenue divided by total marketing spend. It does not depend on attribution, which is why finance likes it. It cannot tell you which creator worked, so it sits next to the attribution range, not in place of it.
| Period | Store revenue, ex VAT | Total marketing spend | MER |
|---|---|---|---|
| April to September 2025 (no creator programme) | EUR 1,050,000 | EUR 180,000 | 5.83x |
| April to September 2026 (with creator programme) | EUR 1,200,000 | EUR 240,000 | 5.00x |
| Change | +EUR 150,000 | +EUR 60,000 | Marginal return 2.50x |
MER fell, and you should explain why before the CFO points at it. When you add a channel whose return is lower than your blended average, blended MER always falls. The question is the marginal return: the extra revenue divided by the extra spend. Here that is EUR 150,000 ÷ EUR 60,000 = 2.50x, above the 1.67x break-even. The comparison assumes other channels' spend stayed flat; if it did not, subtract their change first. Part of the EUR 150,000 is organic growth, which is why the marginal return is an upper bound and the holdout below matters.
Block 6: payback
Payback is the number of months until cumulative gross margin from attributed revenue covers cumulative fully loaded spend. CFOs think in payback periods, so give them one.
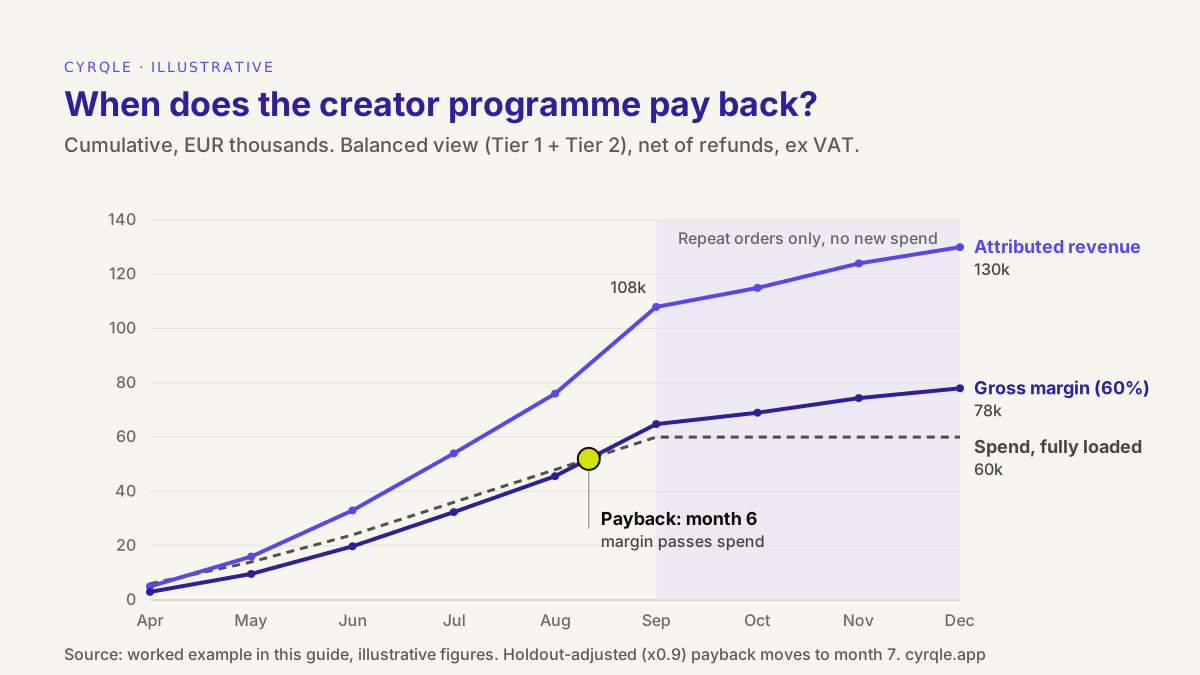
In the balanced view, cumulative gross margin passes cumulative spend in month 6 (September). From October to December, repeat orders from customers first acquired through creators add EUR 22,000 of revenue with no new creator spend, so margin ends the year at EUR 78,000 against EUR 60,000 of spend. Label that repeat revenue as cohort revenue, separate from the 30-day attributed figure.
Give the other views too. Adjusted by the holdout factor below (0.9), payback moves to month 7. In the conservative view, cumulative margin reaches EUR 52,000 by December and the programme has not yet paid back. Showing the slow case is what makes the fast case believable.
Block 7: holdout result and content reuse
A holdout test answers the question attribution cannot: would these sales have happened anyway? In June the brand ran a four-week geographic holdout. Creators posted with local codes in a group of test provinces, and a matched group of control provinces had no creator activity. The method is in our walkthrough of a creator holdout test you can run without a data team.
- Creator spend in the test provinces: EUR 8,000.
- Attributed revenue in the test provinces, balanced view: EUR 15,000.
- Incremental revenue from the holdout comparison: EUR 13,500, with a rough range of EUR 5,000 to EUR 22,000.
- Incremental euros per attributed euro: 13,500 ÷ 15,000 = 0.9.
Report the factor and its range honestly. One four-week test with a range this wide is evidence, not proof. It says that most of the balanced-view revenue was probably caused by creators, and that the conservative view is too pessimistic. It does not justify using the full view. Commit to repeating the test in the next period.
Content reuse goes on a separate line. The brand holds signed licences for 38 creator assets cleared for its own channels and paid ads. At an estimated EUR 150 per asset to produce in-house, that is about EUR 5,700 of avoided production cost. Keep it out of ROI and label it as an estimate: it is real value, but it is not revenue.
Block 8: risks and stop rule
Name the risks before the CFO does. Five are enough.
- Code leakage. Promo codes that reach coupon sites inflate the conservative view. Mitigation: unique codes per creator, usage limits, and a monthly check of code use without a matching link click.
- Returns. Revenue is net of refunds settled so far. A late wave of returns lowers every view.
- Overlap with other channels. The full view can credit sales that email or paid search also touched. That is why the ask is built on the balanced view.
- Concentration. One macro creator took 16% of direct spend. Next year no single creator takes more than 10%.
- One holdout test. The 0.9 factor comes from a single four-week test. It will be repeated in Q1.
Compliance belongs on the list if your creators publish in Spain: disclosure labels and contract terms carry legal risk for the brand. Our legal checklist for influencer marketing in Spain covers what to log.
Block 1: the ask, written last and placed first
Write the ask after the evidence, then move it to the top of the page.
- Amount: EUR 90,000 fully loaded for January to June 2027, up 50%.
- Split: micro creators from 43% to about 55% of direct spend; no single creator above 10%.
- Planning assumption: balanced ROAS of 1.75x, slightly below this year's 1.80x to allow for diminishing returns, partly offset by moving macro budget to micro. At a 60% margin that is about EUR 157,500 of attributed revenue and EUR 4,500 of contribution on first orders, before repeat revenue.
- Release: EUR 45,000 in Q1. The second EUR 45,000 is released only if Q1 balanced ROAS on fully loaded spend is at least 1.6x after refunds.
- Why the lines sit below break-even: the 1.6x release line and 1.4x stop line are under the 1.67x first-order break-even on purpose, because repeat orders add margin after the first purchase. A stricter CFO may prefer lines at or above 1.67x; set them where finance is comfortable.
- Stop rule: pause new bookings if balanced ROAS falls below 1.4x for two consecutive months, or if the Q1 holdout repeat returns an incremental factor below 0.6.
A staged ask with a stop rule moves risk from the CFO to a rule you both agreed in advance. That is often the difference between "come back in Q2" and a yes.
Which questions will the CFO ask, and what should you answer?
Prepare short answers to the five questions finance asks most often about creator budgets, with the source of each number. The table below lists them.
| What to answer | Where the number comes from | |
|---|---|---|
| Is the ROAS real or just tracked? | Show the range and the holdout factor; build the ask on the balanced view | Attribution by confidence tier; your holdout spreadsheet |
| Why did MER go down? | A new channel below the blended average lowers MER; the marginal return is above break-even | Store revenue and total marketing spend from finance |
| When do we get the money back? | Payback month for the balanced and holdout-adjusted views, and the slow case | Cumulative margin vs cumulative spend by month |
| What if it stops working? | The tranche rule and the stop rule | Monthly balanced ROAS after refunds |
| Why not put it in paid social? | Compare marginal return and effective cost per thousand views against paid social, plus reusable content | Ad account reporting; post views from campaign tracking |
If you report for clients rather than for your own CFO, the same blocks fit an agency deck. Our client report template for agencies uses the same range and adds per-creator pages.
How cyrqle helps
cyrqle produces the attribution, spend and content numbers for blocks 2, 3 and 7. The MER, payback and holdout calculations are yours: cyrqle does not compute incrementality, run holdout tests or model MER and payback. You run those in a spreadsheet with your store and finance data.
- Attributed revenue by confidence tier. In Attribution, each creator gets a promo code and a tracking link. A tag under 2KB on your store, a custom pixel for Shopify checkout and signed order webhooks from Shopify, WooCommerce and Magento tie orders to creators. Every sale gets a tier: Tier 1 — promo code, Tier 2 — same-session and Tier 3 — cookied later (30-day window), counted once at its strongest tier, with revenue net of refunds. The Attribution tab shows sales, revenue and clicks by tier, top creators and markets.
- The range in one control. The campaign report has an Attribution confidence setting: Conservative (Tier 1), Balanced (adds Tier 2) and Full (adds Tier 3). Those are the three rows of block 3.
- Exports for your spreadsheet. Reports exports the Brand performance rollup and the Campaign report as PDF or CSV. Read ROAS and revenue by tier from the campaign Attribution tab, and use the exports for the spend and payout lines, so they land in the finance model without retyping.
- Spend and licences. Each payout has a split and a statement, and commission owed on sales is calculated and shown (paying it is a separate step). The Agreements page lists every content-rights licence with its status, which is your count of reusable assets for block 7.
To see the tiers and reports on a category close to yours before budget season ends, book a 30-minute demo.
FAQ
How do I justify an influencer marketing budget with no sales data?
Run a short, tracked test before you ask for the full budget. Give each creator a promo code and a tracking link, run four to six weeks, and bring the attributed range and payback to the CFO. For pure awareness goals, compare effective cost per thousand views with your paid social benchmark instead of claiming revenue.
What ROAS does a CFO expect from influencer marketing?
There is no standard figure. The useful line is your own break-even ROAS, which is 1 divided by your gross margin: 1.67x at a 60% margin, 2.5x at 40%. A programme above break-even in the balanced view makes money on the first order; repeat revenue and reusable content come on top.
Should I use the conservative or the full attribution number?
Use the balanced view as the headline and show the other two beside it. The conservative view undercounts link buyers, and the full view can credit sales that other channels caused. If you have a holdout result, use it to say which end of the range is closer to the truth.
How long should the payback period be for creator marketing?
Compare it with the payback your CFO accepts for other acquisition channels, usually set by your cash position and customer lifetime value. Report payback on the balanced view, the holdout-adjusted view and the conservative view, so finance sees the slow case as well as the fast one.
Do I need a holdout test to get the budget approved?
No, but it helps more than any other single number. Without one, show the attribution range and the marginal MER, and commit to running a geographic holdout in the next period. A promise to test, with a date, answers the "would it have happened anyway?" question better than a high ROAS does.
Sources
- Jon Vaver and Jim Koehler, Measuring Ad Effectiveness Using Geo Experiments, Google, 2011: https://research.google/pubs/measuring-ad-effectiveness-using-geo-experiments/
- GeoLift, open-source geo-experiment package (Meta, facebookincubator): https://github.com/facebookincubator/GeoLift
All figures in the worked example are illustrative and do not describe a real brand. This guide is not financial or accounting advice.
Related material.
Influencer platform comparison template: a weighted scorecard for brands and agencies, with score definitions, demo evidence and a TCO line for Q4 renewals.
Free influencer brief template in nine sections, from objective to approval, with a filled Black Friday 2026 example, disclosure wording and usage rights.
Influencer marketing proposal template for agencies: eight sections from objective to fees, a creator shortlist with labelled estimates and a Q4 worked example.