
Incrementality for creator campaigns: a holdout test without a data team
Run an influencer marketing incrementality test with a geo holdout: pick regions, size the test, then compute lift and a rough range in a spreadsheet.
To run an influencer marketing incrementality test, keep part of your market away from it and compare. Choose two groups of regions with similar order history, run the creators in one group only, and forecast the test group from the other group's orders. The orders above that forecast are the campaign's incremental effect, and you can compute it and a rough confidence range in a spreadsheet.
This matters because attribution and causation are different questions. A promo code tells you which creator a sale followed. It cannot tell you whether the buyer would have bought anyway. That second question is incrementality, and the standard way to answer it is a holdout test. Our guide to measuring influencer marketing ROI sketches the method in one section. This post is the full calculator: how to choose the regions, how big the test must be, how to run it, and how to turn weekly orders into a lift with a range you can defend.
You need weekly orders by region from your store, a spreadsheet, and about 12 weeks: 8 weeks of history you already have, plus 4 weeks of campaign. No data team and no modelling software.
What does an incrementality test measure that attribution does not?
An incrementality test measures the sales that would not have happened without the campaign. Attribution measures the sales that can be linked to a creator. The two numbers overlap but are not the same, and either one can be the larger.
- Attribution can over-count. A loyal customer who was going to buy this week sees a creator's code and uses it to save 15%. The order is attributed to the creator, but it is not incremental.
- Attribution can under-count. A viewer watches a reel, does not click, and two days later searches your brand name and buys at full price. The order is incremental, but no code or link connects it to the creator.
| Question | Attribution (codes, links, pixel) | Holdout test |
|---|---|---|
| What it answers | Which creator did this sale follow? | How many sales did the campaign cause? |
| Unit | One order | A group of regions or customers |
| Counts buyers who would have bought anyway | Yes | No, they appear in both groups |
| Counts buyers who saw the post but left no trace | No | Yes |
| Per-creator detail | Yes | No, only the campaign as a whole |
| When you get it | Daily, during the campaign | Once, after the test closes |
| What it needs | Codes, links, a tag or order webhooks | Enough orders per group, and discipline |
So run both. Attribution ranks creators against each other. The holdout tells you how much to trust the attribution total. If you are still choosing a tracking method, read our comparison of codes, tracking links and the pixel first, because the holdout uses those attributed numbers as an input.
Geo holdout, customer holdout or on/off: which design fits?
Three designs work without a data team. For most creator campaigns the geo holdout is the practical choice, because you cannot control who sees a public post, but you can control which regions your creators, offers and shipping target.
| Geo holdout | Customer holdout | On/off weeks | |
|---|---|---|---|
| How it works | Creators run in some regions; matched regions get nothing new | A random share of a customer list you control does not get the creator content or code | Creators post in some weeks and pause in others, in the same market |
| Best for | Local creators, regional launches, retail and delivery brands | Email, loyalty or app audiences who receive creator content | Always-on programs with steady weekly volume |
| Randomisation | By region, so groups are matched rather than random | True random split, the cleanest comparison | By time, so seasonality is the main risk |
| Main leak | Creator audiences cross regional borders | Customers share codes with each other | Effects carry over into the off weeks |
| What it misses | The national halo from content that travels | New customers outside your list | Slow effects that build over several weeks |
| Volume needed | High: hundreds of weekly orders per group | Medium: a list of tens of thousands | High, and many alternating weeks |
Peer-reviewed geo methods go further than this post. Google researchers described randomised geo experiments for ads in Measuring Ad Effectiveness Using Geo Experiments (Vaver and Koehler, 2011), and Meta's open-source GeoLift package uses synthetic control methods to build the comparison group and to calculate test power. If you have an analyst, those tools give tighter answers. The recipe below is the version you can do by hand.
Step 1: Choose test and holdout regions
Pick regions where you can keep the campaign out of one group, then split them so the two groups move together before the test.
- Pull weekly orders by region for the last 8 to 12 weeks, from your store's order export, grouped by shipping province or autonomous community.
- Exclude what you cannot hold out. Madrid and Cataluña are large enough to dominate either group, and national campaigns, media and events tend to reach them first. The Balearic and Canary Islands have different delivery times. Exclude any region with its own promotion during the test.
- Split the rest into two groups with similar weekly patterns. A simple way: sort regions by weekly orders, then alternate them between groups, and swap pairs until the weekly lines of the two groups look parallel.
- Check the match. Divide test orders by holdout orders for each week. If that ratio stays roughly flat, the holdout is a good forecast for the test group. The spread of that ratio is your noise, which you need in Step 2.
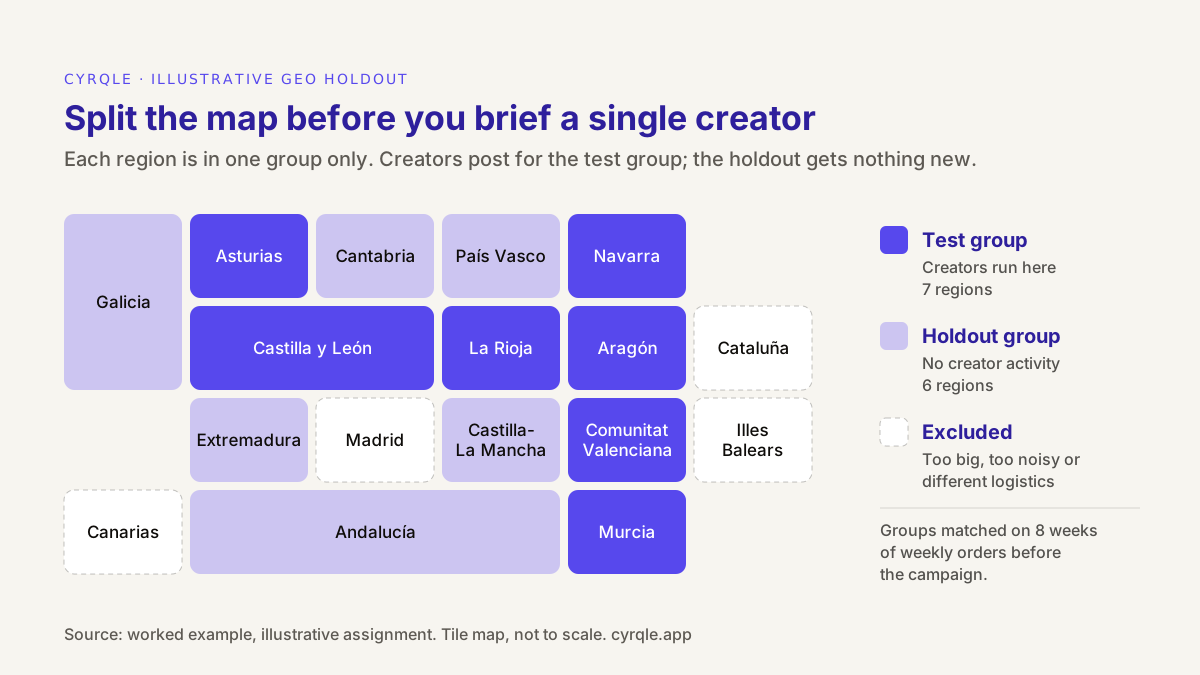
In the worked example, the test group is Asturias, Navarra, Castilla y León, La Rioja, Aragón, Comunitat Valenciana and Murcia. The holdout is Galicia, Cantabria, País Vasco, Extremadura, Castilla-La Mancha and Andalucía. The groups do not need the same population. They need weekly orders that rise and fall together.
Step 2: Size the test before you brief anyone
A test that is too small produces a number, but the number is noise. Check the size before you commit budget, with one formula.
Minimum detectable lift = 2.8 x weekly noise x √(1 / weeks before + 1 / weeks live)
- Weekly noise is the standard deviation of the weekly test-to-holdout ratio in the weeks before, divided by its average. A spreadsheet gives it with
STDEVdivided byAVERAGE. - 2.8 comes from 95% confidence plus 80% power, the usual defaults for an experiment.
- With 8 weeks before and 4 weeks live, the square-root term is 0.61.
Order volume puts a floor under the noise, because counts of orders vary by chance even when nothing changes. The floor for the ratio is about √(2 ÷ weekly orders per group). Real noise is usually higher, because of weather, payday and promotions, so measure yours from the data.
| Weekly orders per group | Noise floor | Smallest lift a 4-week test can detect (8 weeks before) |
|---|---|---|
| 100 | 14% | about 24% |
| 300 | 8% | about 14% |
| 1,000 | 4.5% | about 8% |
| 3,000 | 2.6% | about 4.5% |
Then compare the detectable lift with the lift you can expect. A quick estimate: the attributed orders you got from similar campaigns, divided by the test group's baseline orders for the same weeks. If the campaign might add 5% and the test can only detect 14%, do not run it as designed. Make it longer, add regions, or concentrate more budget in the test group.
Illustrative sizing: the test group averages about 816 orders a week. The weekly ratio has a noise of 5.3%. Minimum detectable lift is 2.8 x 5.3% x 0.61 = 9.1%. Past campaigns of this size produced about 350 attributed orders in four weeks, against a baseline of about 3,260, so the expected lift is about 11%. That is just above the threshold. The brand accepts the risk, knowing that a null result would be inconclusive rather than proof that creators do not work.
Step 3: Run the campaign in the test regions only
The analysis is simple. The discipline is the hard part. Three rules protect the result.
- Keep creators local. Prefer creators whose audience is concentrated in the test regions. Ask each one for a screenshot of their audience by city before you sign. A national creator with half the audience in Madrid leaks the campaign into every group.
- Freeze everything else. No paid campaign, email push, price change or store event that hits only one group during the test. Anything national is fine, because it hits both groups.
- Fix the dates and the rule in advance. Write down the weeks, the regions, the metric (orders or net revenue) and the formula before the campaign starts. Changing them after you see results turns a test into a story.
Log leakage as you go. In your order export, count how many orders using the test creators' codes ship to holdout regions. A few are normal. If it is more than about a tenth of the coded orders, the holdout has seen the campaign and the test will understate the lift.
Step 4: Compute the lift and a rough interval
After the last campaign week, compute four numbers. Here is the full worked example. All figures are illustrative.
| Step | Calculation | Result |
|---|---|---|
| Orders before, 8 weeks | Test 6,525; holdout 6,991 | |
| Pre-period ratio | 6,525 ÷ 6,991 | 0.933 |
| Orders during, 4 weeks | Test 3,683; holdout 3,490 | |
| Expected test orders | 3,490 x 0.933 | 3,257 |
| Incremental orders | 3,683 − 3,257 | 426 |
| Lift | 426 ÷ 3,257 | 13.1% |
| Weekly noise (from Step 2) | standard deviation ÷ average of the weekly ratio | 5.3% |
| Standard error of the lift | 5.3% x √(1/8 + 1/4) | 3.25% |
| Rough 95% range | 13.1% ± 2 x 3.25% | 6.6% to 19.6% |
| In orders | 3,257 x 6.6% to 3,257 x 19.6% | about 215 to 640 |
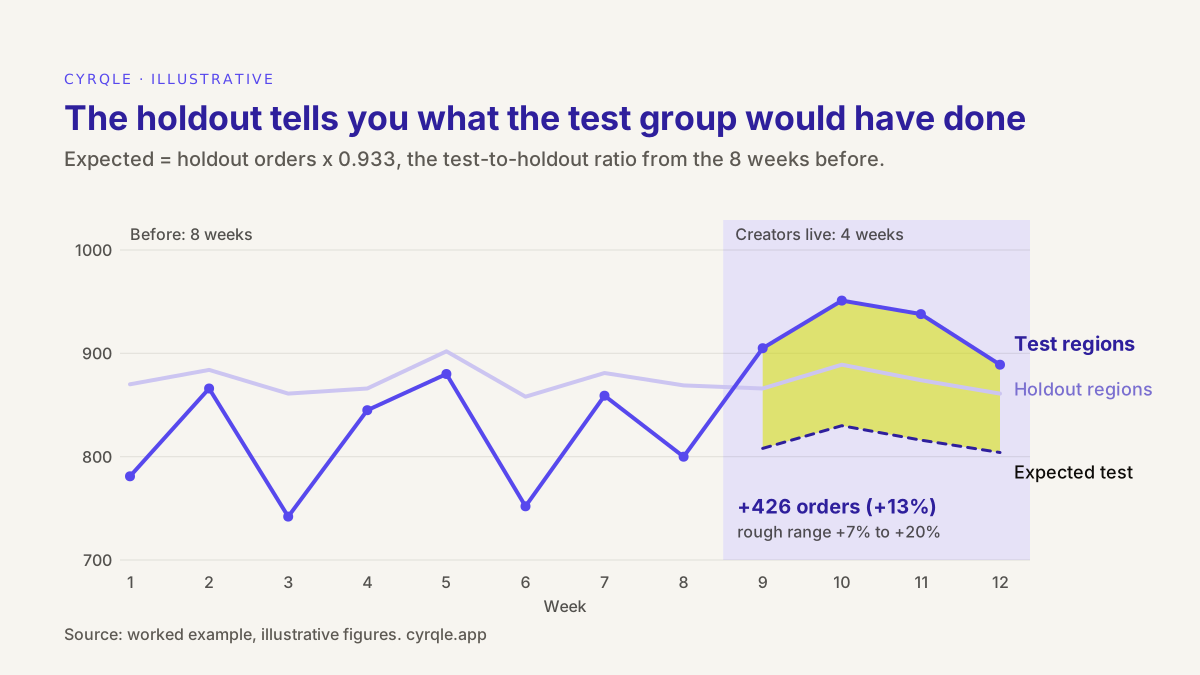
The result reads like this: the campaign probably added between about 215 and 640 orders, with 426 as the best estimate. That is a real effect, because the whole range is above zero. It is also an imprecise one, and the report should say so.
Two cautions keep the interval honest. First, the formula treats each week as independent. Real weeks are not, so the true range is likely wider. Treat this one as the narrowest it could be. Second, run a placebo check: apply the same calculation to weeks 1 to 4 versus weeks 5 to 8 of the history, when nothing changed. If that "lift" is far from zero, your groups are not matched well enough to trust the real one.
Step 5: Turn the lift into money and compare it with attribution
A lift in orders becomes useful when you put it next to the cost and next to what attribution claimed.
Illustrative: net revenue per order after VAT and refunds is EUR 58. The campaign cost EUR 12,000 in fees, product and shipping. Gross margin is 55%, so break-even ROAS is 1 ÷ 0.55 = 1.82x.
| Measure | Orders | Revenue | ROAS on EUR 12,000 |
|---|---|---|---|
| Attributed, Tier 1 + Tier 2 (code and same-session link) | 283 | EUR 16,414 | 1.37x |
| Attributed, all tiers (adds buyers who returned later) | 371 | EUR 21,518 | 1.79x |
| Incremental, best estimate | 426 | EUR 24,708 | 2.06x |
| Incremental, low end of range | 215 | EUR 12,470 | 1.04x |
| Incremental, high end of range | 640 | EUR 37,120 | 3.09x |
Three conclusions follow.
- The campaign probably paid back on first orders, because the best estimate of 2.06x clears break-even at 1.82x. It is not proven, because the low end of the range does not.
- Attribution did not overstate this campaign. The incremental estimate is 1.15 times the all-tier attributed total, with a range of about 0.6 to 1.7. Attribution may have missed some sales from people who watched and bought without a code.
- You now have a calibration factor. Next time, you can multiply the attributed total by a factor in that range instead of assuming a factor of exactly 1. Repeat the test before you rely on it.
The test measures first orders inside the window only. Repeat purchases from the new buyers come later, so follow the cohort for 60 to 90 days, as we argue in optimise creators on the cohort, not the click.
When should you not run a holdout test?
Skip the test, or postpone it, in these cases:
- Fewer than about 300 weekly orders per group. You will only detect very large effects. Use attribution ranges and a longer program instead.
- A national creator or a viral format. If the content is meant to travel, a regional holdout cannot contain it.
- A tentpole week. Black Friday, Hot Sale or the start of the summer sales add noise that swamps a creator effect.
- You cannot afford the holdout. The holdout regions give up the campaign's sales for four weeks. For a launch you need everywhere, that cost may be too high.
- An awareness goal. If the objective is reach, judge the campaign on views and cost per thousand views. Our guide to KPIs by campaign objective covers the right metric for each goal.
For agencies, a holdout is a strong way to answer a sceptical client, but only if the client has the volume. Our playbook to prove creator ROI to a client in 30 days shows how to build a pilot around attribution ranges first, and when to add a holdout.
How cyrqle helps
cyrqle does not compute incrementality, pick holdout regions or run the test. It gives you the attribution input the test needs, and keeps it separate from the test result.
- Attributed orders by confidence tier. In Attribution, every sale carries a tier: Tier 1 — promo code, Tier 2 — same-session and Tier 3 — cookied later (30-day window). Each order counts once, at its strongest tier, and revenue is net of refunds. These are the 283 and 371 rows in the Step 5 table.
- Codes and links per creator. Each creator gets their own promo code and tracking link, so when you brief only the test-region creators, every attributed order belongs to the test campaign by design. You can mint and export codes in bulk.
- Sources you already have. A tag under 2KB on your store, a custom pixel for Shopify checkout, signed order webhooks from Shopify, WooCommerce and Magento, and a cashier redemption page for in-store codes.
- A range, not one number. The on-screen campaign report has an Attribution confidence dial: Conservative counts promo codes only, Balanced adds same-session, Full adds cookied-later. That gives you the attribution range to put next to your holdout range. Reports exports reports as PDF or CSV for your spreadsheet.
The weekly orders by region come from your own store. The lift, the interval and the calibration factor are yours to compute with the steps above. To see the attribution tiers on your own category, book a 30-minute demo.
FAQ
How long should an influencer marketing incrementality test run?
Usually four weeks of campaign after at least eight weeks of history. Shorter tests rarely have the power to detect a realistic creator effect. If Step 2 says your detectable lift is too high, extend to six or eight weeks rather than shortening the history.
Can I run a holdout test with a small store?
Only for large effects. With about 100 weekly orders per group, a four-week test detects lifts of roughly 24% or more. Below about 300 weekly orders per group, report attribution as a range and build volume before you test.
Is a holdout test the same as marketing mix modelling?
No. A holdout is an experiment: you change one thing in one group and compare. Marketing mix modelling is a statistical model fitted to years of spend and sales across all channels. A holdout answers one question about one campaign; MMM estimates every channel at once and needs much more data.
What if the lift comes out negative?
If the range includes zero, the test is inconclusive, not a proof that the campaign hurt sales. Check leakage, the placebo test and any one-sided promotion first. A clearly negative range with clean groups is rare; one possible cause is that the campaign pulled forward sales that would have happened later, but check the group match first.
Should I pay creators on incremental sales?
Rarely. Incrementality is measured for the whole campaign, not per creator, and only after the test closes. Pay commission on attributed sales as the contract states, and use the holdout result to decide next season's budget and rates.
Sources
- Jon Vaver and Jim Koehler, Measuring Ad Effectiveness Using Geo Experiments, Google, 2011: https://research.google/pubs/measuring-ad-effectiveness-using-geo-experiments/
- GeoLift, open-source geo-experiment package (Meta, facebookincubator): https://github.com/facebookincubator/GeoLift
Related field notes.
Returns-adjusted ROAS for fashion creator campaigns: gross vs net ROAS per creator with worked numbers, why commission waits for returns, and who changes rank.
How to measure influencer marketing ROI past the discount code: the formula, windows, refunds, repeat purchase, confidence tiers and a worked euro example.
How to tell whether the creator content on your site is earning its place. The metrics that matter at each step, from wall impressions to product clicks to attributed orders, and the traps that make the numbers look better or worse than they are.