
Influencer campaign report template for agency clients
Influencer campaign report template for agencies: a one-page client report in seven blocks plus an appendix, in slide and sheet form, with a worked example.
An influencer campaign report template for agency clients should fit the result on one page and the proof in an appendix. The page has seven blocks: the objective and a one-line verdict, what the campaign cost the client, reach and effective CPM, attributed revenue split by confidence tier, the top creators, the content worth reusing, and the next actions. The appendix holds the roster, every post, the definitions and the data sources.
Picture an agency in Valencia on the first working day of the month. The marketing director of a running-shoe brand has ten minutes before her own leadership meeting. She needs to know three things: did the campaign do what we bought it for, what did it cost per result, and what do we do next? If the answers are on page one, she forwards the page. If they sit on slide 14 of a 30-slide deck, she asks for a call, and your account team loses an afternoon.
This guide gives you the one-page template block by block, as copyable text, then the appendix, then the same template laid out as slides and as a spreadsheet. A filled example with illustrative numbers shows how the blocks read for a real-shaped campaign. For the vendor side of the same problem, what your reporting tool must do before a client ever sees a file, read our white-label influencer reporting checklist for agencies.
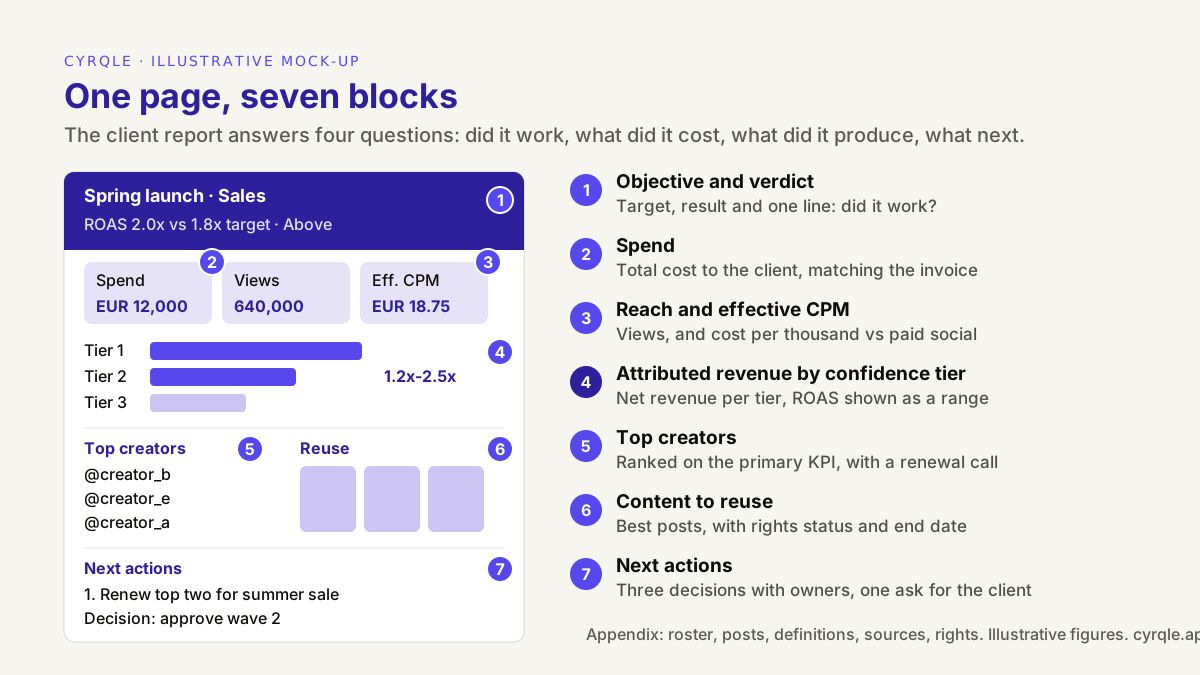
What goes on a one-page influencer campaign report?
A one-page influencer campaign report answers the client's questions in the order they ask them: first whether it worked, then what it cost, then what it produced, then what to do next. Seven blocks cover that order. Each block has one job, and each number on the page links to a definition in the appendix.
| Block | What it shows | The client's question | Where the data comes from |
|---|---|---|---|
| 1. Objective and verdict | The objective, the primary KPI, the target, the result and a one-line verdict | Did it do what we bought it for? | The brief and the agreed KPI |
| 2. Spend | Total cost to the client for the period, against budget | What did it cost us? | Your invoice to the client |
| 3. Reach and effective CPM | Views or accounts reached in the target market, and cost per thousand | How many people saw it, and was that good value? | Post tracking; the client's paid-social benchmark |
| 4. Attributed revenue by tier | Net revenue and orders per confidence tier, and ROAS as a range | Did it sell, and how sure are you? | Promo codes, tracking links, pixel or order webhooks |
| 5. Top creators | The three to five creators who drove the primary KPI | Who should we keep working with? | Per-creator results |
| 6. Content to reuse | The posts worth reusing, with rights status | What can we use again, and where? | Post results and licences |
| 7. Next actions | Three decisions with an owner and a date | What do we do now? | Your recommendation |
Two rules hold the page together. First, every block uses the same period and the same currency, stated once at the top. Second, the page shows the objective's primary KPI first. A sales campaign leads with attributed revenue; an awareness campaign leads with reach and effective CPM. Our guide to influencer marketing KPIs by objective gives the primary KPI, the guardrail and the vanity metric to drop for each of the eight common objectives.
The one-page template, block by block
Copy each block into your document, slide or sheet. Replace everything in square brackets. Delete any line you cannot support with data in the appendix.
Block 1. Objective and verdict
[Client] · [Campaign name] · [Period: dd/mm/yyyy to dd/mm/yyyy]
Objective: [Sales | Lead gen | Traffic | Free trial | Booking | UGC | Awareness | Engagement]
Primary KPI: [e.g. ROAS on net revenue, Tier 1 + Tier 2]
Target: [value]      Result: [value]      Status: [Above | On | Below target]

Verdict: [One sentence. What happened, in plain words, and why.]
All amounts in EUR, excluding VAT. Revenue is net of refunds.
What clients check. Whether the result matches the target they agreed, in the unit they agreed. A verdict that changes the KPI after the fact ("sales were slow, but engagement was strong") reads as an excuse.
Fill-in notes. Write the verdict last. Keep it under 25 words and make it a judgement, not a summary: "Above target on sales; two creators drove 60% of Tier 1 revenue." If the result is below target, say so in this line, then explain it in block 7.
Block 2. Spend
Total cost to client: EUR [amount]  ([x]% of EUR [budget] budget)
  Creator fees and production: EUR [amount]   <- or one combined line, per your contract
  Agency fee:                  EUR [amount]
Paid: EUR [amount]   Outstanding: EUR [amount]
Not included: [paid media, product cost, shipping]
What clients check. That the total matches your invoice, and what is left out. A finance team that finds the report total and the invoice total differ will stop trusting every other number.
Fill-in notes. Use the price the client pays, not your cost. If your contract keeps creator fees private, show one combined line. If it promises cost transparency, show creator fees and agency fee as two lines. The guide to how agencies price influencer services covers which fee models require which view.
Block 3. Reach and effective CPM
Posts live: [n] of [n] planned      Creators: [n]
Views: [n]      Accounts reached: [n, where available]
Share of views in target market: [x]% (where the platform reports it)
Effective CPM: EUR [amount]  = total cost to client / views x 1,000
Benchmark: client's paid-social CPM for the same audience: EUR [amount]
What clients check. Whether the reach was worth the price compared with what they already buy. A view count without a cost per thousand next to it is a vanity number.
Fill-in notes. Calculate effective CPM on the total cost to the client from block 2, so the figure cannot be worked back to a creator fee. Ask the client for their own paid-social CPM for the same audience at kick-off, not at report time. If creator content costs more per thousand views, the report must show what the premium bought, in block 4 or block 6. Our post on choosing creators by views and effective CPM explains the formula in detail.
Block 4. Attributed revenue by confidence tier
Attributed revenue (net of VAT and refunds), [attribution window]:
  Tier 1 - promo code:          EUR [amount]   [n] orders
  Tier 2 - same-session click:  EUR [amount]   [n] orders
  Tier 3 - cookied, later:      EUR [amount]   [n] orders
  Total:                        EUR [amount]   [n] orders

ROAS on total cost to client:
  Tier 1 only: [x.x]x   Tier 1+2: [x.x]x   All tiers: [x.x]x
Agreed headline ROAS: [Tier 1+2 | other, as agreed at kick-off]
What clients check. Which number to repeat in their own meeting. If you give one blended ROAS, a sceptical CFO will ask how much of it the creators really caused. A range answers that question before it is asked.
Fill-in notes. A confidence tier says how directly a sale is linked to a creator. A sale with the creator's own promo code is the strongest evidence; a click and purchase in the same session is next; a click followed by a purchase days later inside the attribution window is the weakest. Agree at kick-off which tiers count toward the headline ROAS, and keep that rule for the whole engagement. Our comparison of discount codes, tracking links and the pixel covers what each method can and cannot prove. For non-sales objectives, replace this block with the objective's primary result: leads, bookings, trials or sessions.
Block 5. Top creators
Top creators by [primary KPI]:
  1. @[handle]  [primary KPI value]  [second metric, e.g. eff. CPM or Tier 1 orders]
  2. @[handle]  ...
  3. @[handle]  ...
Recommendation: [renew | renew with changes | do not renew] for each
What clients check. Who to book again, and whether the creators they liked personally actually performed.
Fill-in notes. Rank on the primary KPI, not on followers or likes. Three creators is enough for most campaigns; five for rosters above 20. Leave creator fees off this block even if the client sees them in the appendix. The page is about results.
Block 6. Content to reuse
Content worth reusing:
  [Post link or thumbnail] @[handle] [format]  why: [metric]  rights: [cleared to (date) | requested | none]
  [Post link or thumbnail] ...
  [Post link or thumbnail] ...
Suggested use: [paid ads | product page | email | organic repost]
What clients check. Whether they can use the content, and for how long. Clients often treat a great post as theirs. It is not, unless the contract or a licence says so.
Fill-in notes. Pick two to four posts. State the rights status for each, with the end date of the licence. Use only the uses the creator agreed to: paid ads usually need explicit permission. If rights are missing, the next-action block should include asking for them; our guide on how to request content rights from a creator walks through the request.
Block 7. Next actions
Next actions:
  1. [Decision]  Owner: [agency | client]  By: [date]
  2. [Decision]  Owner: ...
  3. [Decision]  Owner: ...
Decision needed from you: [one clear ask, e.g. approve budget for wave 2 by dd/mm]
What clients check. What they have to decide, and by when.
Fill-in notes. Three actions, each a decision, not an activity. "Renew @creator_b with a second code for the summer sale" is an action. "Keep optimising the programme" is not. End with the one decision you need from the client.
What goes in the appendix?
The appendix is the evidence behind the page. A client rarely reads it in full, but their analyst, finance team or procurement will check it. If a number on page one has no line in the appendix, someone will ask where it came from.
- Full creator roster. Every creator, their status, posts planned and published, views, engagement, and their results on the primary KPI. Include creator fees only if your contract shows them.
- Every post. Link, date, platform, format, views, interactions and the tracking code or link used.
- Definitions and formulas. Effective CPM, ROAS, each confidence tier, the attribution window, what "net revenue" excludes (VAT, refunds, shipping), and how views are counted.
- Attribution rules. Which tiers count toward the headline ROAS, how overlapping codes and links are resolved, and any offline sales recorded by hand.
- Data sources and dates. Where each number comes from (platform post data, the store's orders, your invoices) and the date and time it was exported.
- Rights register. For each reused or reusable post: the licence, the permitted uses, the territory and the end date.
- Changes since the last report. Any restated number and the reason.
Keep the appendix in the same order every month. A client who learns where to find the roster in May should find it in the same place in June.
The template as slides
Most agency clients receive the report as a PDF of slides. Keep the one page as a single slide, and put the appendix behind it.
| Slide | Content | Notes |
|---|---|---|
| 1 | The one-page report: blocks 1 to 7 | The only slide most readers see. Must work when forwarded alone |
| 2 | Attributed revenue by tier, as a chart, with the ROAS range | Repeat the tier definitions under the chart |
| 3 | Top creators, with their posts and results | One row per creator, thumbnails if you have rights to show them |
| 4 | Content to reuse, with rights status and suggested use | Thumbnails plus licence end dates |
| 5 | Next actions and the decision needed | Same as block 7, with more context |
| 6 onward | Appendix: roster, posts, definitions, sources, rights register | Tables, not charts |
Put your agency's name and the client's name on slide 1 and in the footer of every slide. Single slides get forwarded, and a slide with no name on it loses its source.
The template as a spreadsheet
The spreadsheet version is the working file behind the slides and the version a client's analyst will ask for. Use one tab per appendix section, and one summary tab that holds the seven blocks.
| Tab | Columns | Formula notes |
|---|---|---|
| Summary | Block, metric, value, target, status, note | References the other tabs; no typed-in numbers |
| Spend | Line, amount excl. VAT, paid, outstanding, invoice number | Total cost to client = sum of client-facing lines |
| Creators | Handle, platform, status, posts planned, posts live, views, interactions, Tier 1 revenue, Tier 1 orders, all-tier revenue | Per-creator effective CPM only if fees are visible to the client |
| Posts | Post URL, handle, date, format, views, interactions, code, tracking link | One row per published post |
| Sales by tier | Tier, orders, net revenue, refunds, net after refunds | ROAS per tier = cumulative net revenue / total cost to client |
| Content | Post URL, why it worked, rights status, permitted uses, licence end date | Filter on "cleared" for block 6 |
| Definitions | Term, definition, formula, source | Same wording as the slide appendix |
Two formulas do most of the work:
- Effective CPM = total cost to client ÷ views × 1,000.
- ROAS for a tier range = net attributed revenue for those tiers ÷ total cost to client.
Lock the summary tab so it only references other tabs. A number typed straight into the summary is the one that will disagree with the PDF.
Worked example: a spring launch for a running-shoe brand
An agency runs a four-week launch for a running-shoe brand that sells online in Spain. The objective is Sales. The headline KPI, agreed at kick-off, is ROAS on Tier 1 and Tier 2 revenue, with a target of 1.8x. All figures are illustrative.
- Spend. Total cost to the client: EUR 12,000 excluding VAT, the full budget. That is the creator fees as billed plus the agency fee; the contract keeps the split private.
- Reach. 8 creators, 14 posts live out of 14 planned, 640,000 views. Effective CPM: EUR 12,000 ÷ 640,000 × 1,000 = EUR 18.75. The client's paid-social CPM for the same audience is EUR 11, so the creator reach costs more per thousand and has to earn the premium in sales.
- Attributed revenue, net of VAT and refunds, 30-day window:
| Confidence tier | Orders | Net revenue | Cumulative revenue | Cumulative ROAS |
|---|---|---|---|---|
| Tier 1: promo code | 162 | EUR 14,200 | EUR 14,200 | 1.2x |
| Tier 2: same-session click | 104 | EUR 9,800 | EUR 24,000 | 2.0x |
| Tier 3: cookied, later | 71 | EUR 6,400 | EUR 30,400 | 2.5x |
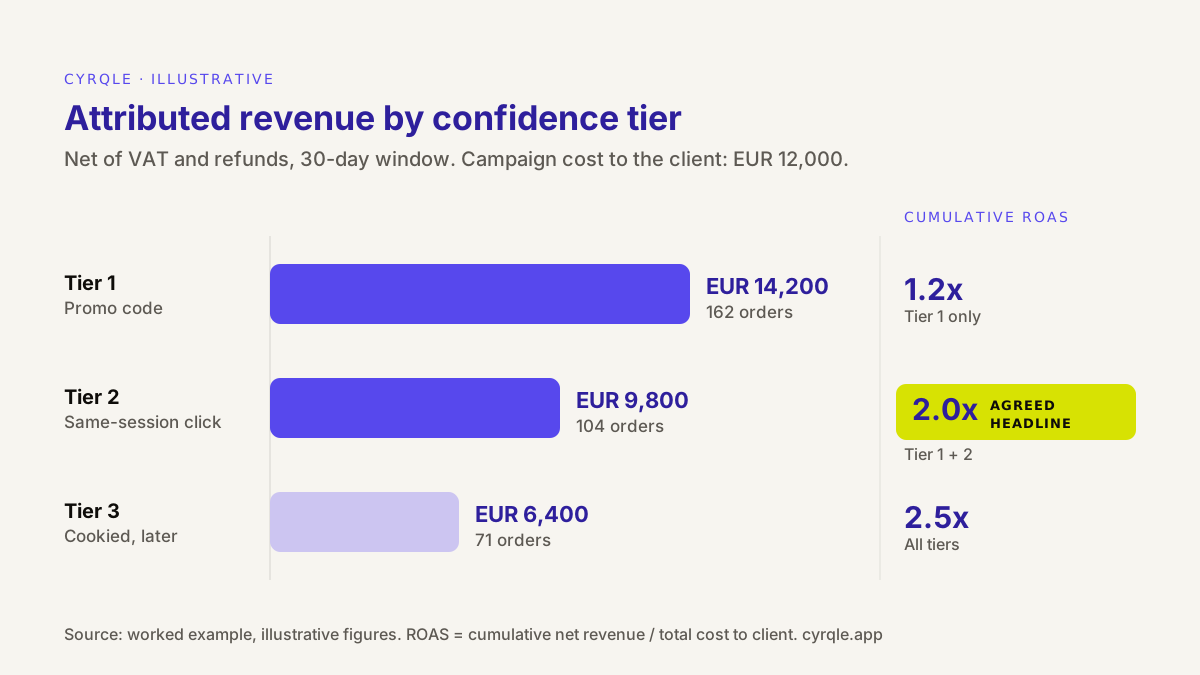
On the one page, block 1 reads: "Objective: Sales. Primary KPI: ROAS on Tier 1 + Tier 2. Target 1.8x. Result 2.0x. Above target. Verdict: Above target on sales; two creators drove most of the promo-code revenue, and the higher CPM paid for itself." Block 4 shows the three tiers and the range 1.2x to 2.5x, with 2.0x marked as the agreed headline.
Block 5 names the two creators who drove most of the Tier 1 revenue and recommends renewing both. Block 6 lists three Reels with cleared rights for the client's product pages until the end of the year. Block 7 asks for one decision: approve a second wave with the top two creators for the summer sale, by a set date.
The example also shows why the range matters. Reported as one blended number, the campaign is "2.5x". A CFO who asks how much of that the creators really caused will then hear "well, some of it". Reported as a range with an agreed headline, the answer is already on the page: at least 1.2x on promo codes alone, 2.0x on the agreed basis.
Weak report or client-ready report?
Most reports that frustrate clients have the right data in the wrong shape. This table compares the common failure with the version that works.
| Weak report | Client-ready report | |
|---|---|---|
| Opening | Total impressions and a montage of posts | Objective, target, result and a one-line verdict |
| Cost | Missing, or only creator fees | Total cost to the client, matching the invoice |
| Reach | Followers and total impressions | Views, share in the target market and effective CPM against a paid benchmark |
| Sales | One blended ROAS, or discount-code sales only | Net revenue by confidence tier, ROAS as a range, agreed headline tier |
| Creators | Every creator, sorted by follower count | Three to five creators ranked on the primary KPI, with a renewal call |
| Content | Best posts by likes | Posts worth reusing, with rights status and licence end date |
| Ending | "Thank you" slide | Three next actions with owners, and one decision for the client |
| Proof | Numbers with no source | Appendix with definitions, formulas, sources and export dates |
The fix is rarely more data. It is putting the client's three questions first and moving everything else behind the page.
How do you hide creator fees without breaking the numbers?
Hide creator fees by calculating every cost metric on the client's total cost, not on what you paid creators. Effective CPM, cost per order and ROAS are all built from spend. If you hide the fee column but leave a CPM or ROAS calculated on creator fees, a client can work the fee back with a calculator.
There are two clean options, and your contract decides which applies:
- Fees private. Show one total cost line. Calculate effective CPM, cost per order and ROAS on that total. Leave per-creator cost metrics out of the client report.
- Fees transparent. Show creator fees and the agency fee as separate lines. You can then show per-creator effective CPM, because the client already sees each fee.
Whichever option you use, keep it the same in the PDF, the slides and the spreadsheet. A CSV export that still contains a fee column undoes a carefully hidden PDF. For the full software side of this, including client separation and per-client terms, see our guide to influencer software built for agencies.
How cyrqle helps
The Campaign report in Reports gives you most of the one page without copy-paste. On the campaign's report page you can edit the Highlights, Conclusions and Next steps text, set targets, and hide sections the client should not see; the PDF prints what the page shows. The report includes Top creators, Top publications, delivery and reach, What it cost, and, when sales are attributed, Attributed sales with revenue by tier. Export it as a PDF for the client, or the roster as a CSV for the appendix.
Two settings matter for agencies. Reports exported from your agency workspace read "Prepared by [your agency] for [client]" and carry your agency's name in the page header; a small cyrqle mark stays on the cover, so check an export against your contract. And the campaign setting Hide creator fees from client reports removes fee, spend, CPM, ROAS and payout figures from the client PDF. With fees hidden, add your total cost to the client and the ROAS range calculated on it in blocks 2 and 4 yourself.
The Brand performance export rolls up every campaign for a client: campaigns, creators engaged, spend committed and paid, and posts published. Use it for the quarterly appendix. It does not roll revenue up across campaigns today, so take revenue from each campaign's report or from the Attribution tab, where sales, revenue and clicks are split by tier (attribution). A PDF is a snapshot at the moment of export; date it, and treat the Attribution tab as the live figure.
The agency console on cyrqle for agencies handles the rest of the monthly routine: one client list, per-member access per client, and Act-As to work inside a client's workspace with an audit trail. If you want to see a Campaign report built on your own category, book a 30-minute walkthrough.
FAQ
How long should an influencer campaign report be?
One page for the result, plus an appendix for the proof. Most clients read only the first page, so it must answer whether the campaign worked, what it cost and what to do next. The appendix can run to as many pages as the roster and post list need.
Should the client report show creator fees?
Only if your contract promises cost transparency. If fees are private, show one total cost line and calculate effective CPM and ROAS on that total, so the fee cannot be worked back. If fees are transparent, show creator fees and your agency fee as separate lines.
How often should an agency send campaign reports?
Send a full report at the end of each campaign or wave, and a short monthly version for always-on programmes. Use the same template and the same appendix order every time, so the client can compare months without re-reading definitions.
What if the campaign missed its target?
Say so in the verdict, in the first line. Then use the top-creators, content and next-actions blocks to show what worked and what you will change. A report that hides a miss loses the client's trust in every later report.
Which ROAS should go in the headline?
The one you agreed at kick-off. Many agencies use Tier 1 plus Tier 2, promo-code and same-session sales, as the headline, and show Tier 1 alone and all tiers as the lower and upper bounds. What matters is that the rule does not change after you see the results.
Related material.
Influencer marketing proposal template for agencies: eight sections from objective to fees, a creator shortlist with labelled estimates and a Q4 worked example.
Manage multiple clients on one influencer platform: link client brands in cyrqle, set per-member access, Act As, set fees and export white-label reports.
Influencer platform comparison template: a weighted scorecard for brands and agencies, with score definitions, demo evidence and a TCO line for Q4 renewals.