
Instagram and TikTok engagement rate benchmarks 2026: Spain, Mexico and LatAm by follower tier
Instagram engagement rate by follower count, plus TikTok, for Spain, Mexico and LatAm: 2026 medians with quartiles and n per tier, and the formula behind them.
The median Instagram creator earns 0.82% engagement per post, measured as (likes + comments) / followers, and the number hardly moves with account size: 0.89% for nano creators and 0.86% for creators above one million followers. On TikTok, engagement per follower falls as accounts grow, from 0.58% for nano creators to 0.17% for mid-tier creators.
Published benchmarks for the same Instagram nano creator range from 0.89% (this report) to 4.2% (SociaVault), almost 5x apart, because they divide by different things and use different statistics. Some divide by followers, some by reach, some by views. Some report an average, some a median, some do not say. None we checked splits Spain from Mexico, and none gives a sample size for each tier.
This report gives one formula, one method and a sample size in every cell. It covers 16,593 Instagram creators and 78,293 TikTok creators, split by follower tier and by profile country (Spain, Mexico, Colombia and Argentina). It is written for brand and agency teams who use engagement rate to shortlist creators.
How did we measure engagement rate?
Engagement rate (ER) in this report is (likes + comments) divided by the creator's current followers, for each feed post. Each creator's ER is the median of their 12 most recent qualifying posts. Each benchmark cell is the median across creators, with the 25th and 75th percentiles (p25 and p75) and the number of creators (n).
The engagement rate has many definitions. We use the per-follower one because it is the only version you can compute from public data for any creator, before you have access to their insights.
The sample
- Creators only. Brand accounts, media publishers, fan pages, teams and businesses are excluded.
- Public accounts with 1,000+ followers. 16,593 Instagram creators (175,843 posts) and 78,293 TikTok creators (801,178 posts), about 977,000 posts in total.
- Feed posts from January 2024 to November 2026. Stories are excluded. Posts with zero or hidden likes are dropped. Each creator needs at least 3 qualifying posts; we use up to 12.
- Outliers. Creators with a median ER above 100% are dropped as follower-count errors (9 on Instagram, 101 on TikTok).
- Small cells. Any cell with fewer than 50 creators is marked "insufficient" and not published.
- Country is profile country, not audience country.
Follower tiers used here
| Tier | Followers |
|---|---|
| Nano | 1,000 to 9,999 |
| Micro | 10,000 to 49,999 |
| Mid | 50,000 to 499,999 |
| Macro | 500,000 to 999,999 |
| Mega | 1,000,000 and over |
Other sources cut differently. Our glossary, for example, puts the micro-influencer band up to about 100,000 followers. In this report a tier is a follower band only. It is not a status level such as a platform's creator tier.
Why the median creator's median post
A median of medians describes the typical post of the typical creator. One viral post cannot move a creator's median, and one huge account cannot move a tier's median. The result is conservative by design, and it is lower than most published benchmarks. The section on vendor benchmarks below explains the gap.
What is the Instagram engagement rate by follower count?
The median Instagram creator's engagement rate is 0.82% per post (n=16,593), and it is almost the same in every follower tier. Nano and micro creators both sit at 0.89%, mid-tier and macro creators at about 0.70%, and mega creators at 0.86%. The rank correlation between followers and ER is -0.07.
Follower count barely predicts Instagram engagement
On Instagram, a creator's follower count tells you almost nothing about their engagement rate. The Spearman rank correlation between followers and ER is -0.07 across 16,593 creators, and the log-log slope is -0.05. In plain terms: a creator with ten times more followers has, on average, about the same ER.
This contradicts the common claim that "smaller accounts always engage more". On Instagram, the typical nano creator and the typical mega creator engage at almost the same rate per follower. The difference is in the spread: inside every tier, some creators engage far more than others.
Spain, Mexico and Latin America on Instagram
The table shows the median, the p25 to p75 range and the number of creators for each cell. Read the range as "half of the creators in this tier sit between these two values".
| Tier | All countries | Spain | Mexico | Colombia |
|---|---|---|---|---|
| Nano 1k-10k | 0.89% (0.26-2.90) n=6,896 | see note | insufficient | insufficient |
| Micro 10k-50k | 0.89% (0.32-2.37) n=2,905 | 0.89% (0.47-2.01) n=946 | 0.59% (0.26-1.29) n=143 | insufficient |
| Mid 50k-500k | 0.72% (0.24-1.84) n=4,760 | 0.85% (0.38-1.79) n=1,577 | 0.59% (0.21-1.57) n=309 | 0.48% (0.25-1.21) n=89 |
| Macro 500k-1M | 0.70% (0.23-2.10) n=747 | 0.84% (0.34-1.88) n=210 | 0.33% (0.14-0.82) n=62 | insufficient |
| Mega 1M+ | 0.86% (0.25-2.72) n=1,285 | 0.71% (0.32-2.15) n=176 | 0.69% (0.32-1.64) n=102 | 0.37% (0.23-1.01) n=57 |
| All tiers | 0.82% (0.26-2.41) n=16,593 | 0.89% (0.41-1.98) n=3,042 | 0.60% (0.21-1.56) n=642 | 0.47% (0.23-1.21) n=208 |
Argentina, all tiers: 1.01% (0.31-3.03), n=68. Argentine tier cells are below 50 creators and are not published.
Spanish Instagram creators sit at or slightly above the global median in the micro, mid and macro tiers (0.84% to 0.89%). Mexican creators sit lower in every tier we can publish, and Colombia lower still on the two cells with enough data. Treat the Mexican macro cell (n=62) and the Colombian cells (n=57 to 89) as directional.
An independent dataset shows the same flat shape. Click Analytic's Spain creator economy report, measured in August 2026 on 108,392 Instagram accounts with 10,000+ followers, gives medians of 0.97% at 10k-50k followers, 0.68% at 50k-250k and 0.74% at 250k+ (Click Analytic, Spain). The report does not publish its formula and excludes nano accounts, but the level and the shape match ours. Its Mexico report also puts Mexico below Spain (Click Analytic, Mexico).
What is the TikTok engagement rate by follower count?
The median TikTok creator gets 0.30% engagement per follower per post (n=78,293), and the rate falls as accounts grow. In Spain, nano creators get 0.59%, micro creators 0.37% and mid-tier creators 0.20%. Above 500,000 followers the curve flattens and rises slightly, to 0.30% for mega creators.
TikTok engagement per follower falls with size
On TikTok, follower count does predict engagement rate, and the relation is negative. The Spearman correlation is -0.26 across 78,293 creators. The log-log slope is -0.21, which means each 10x in followers multiplies ER per follower by about 0.61. From 5,000 to 250,000 followers, ER falls to about a quarter of its starting value; above that it flattens.
The likely reason is how TikTok distributes video. Much of its distribution runs through the For You feed rather than through follows, so a follower count is a weaker measure of who sees a post. As an account grows, its follower count rises faster than the views each video gets.
Spain, Mexico and Latin America on TikTok
| Tier | All countries | Spain | Mexico | Colombia | Argentina |
|---|---|---|---|---|---|
| Nano 1k-10k | 0.58% (0.28-1.13) n=12,359 | 0.59% (0.30-1.05) n=7,608 | 0.66% (0.37-1.46) n=185 | insufficient | insufficient |
| Micro 10k-50k | 0.34% (0.15-0.78) n=28,699 | 0.37% (0.18-0.79) n=17,038 | 0.41% (0.18-1.18) n=435 | 0.43% (0.14-1.03) n=91 | 0.44% (0.22-1.07) n=84 |
| Mid 50k-500k | 0.17% (0.06-0.61) n=25,467 | 0.20% (0.07-0.71) n=9,868 | 0.17% (0.05-0.52) n=421 | 0.27% (0.11-0.85) n=70 | 0.17% (0.06-1.06) n=82 |
| Macro 500k-1M | 0.19% (0.05-0.71) n=4,707 | 0.22% (0.05-0.91) n=983 | 0.17% (0.05-0.70) n=61 | insufficient | insufficient |
| Mega 1M+ | 0.24% (0.06-0.81) n=7,061 | 0.30% (0.08-0.93) n=1,054 | 0.21% (0.04-0.95) n=100 | insufficient | insufficient |
| All tiers | 0.30% (0.11-0.81) n=78,293 | 0.37% (0.15-0.86) n=36,551 | 0.33% (0.11-0.93) n=1,202 | 0.39% (0.12-0.98) n=208 | 0.39% (0.13-1.37) n=227 |
The four markets are close on TikTok. Spain, Mexico, Colombia and Argentina all sit between 0.33% and 0.39% per follower in the all-tiers row, and they share the same downward shape. The Colombian and Argentine tier cells are small (70 to 91 creators), so read them as directional.
Is the TikTok decline real?
Yes. Most TikTok posts in the sample are from the first half of 2024, and most follower counts were collected in May 2025. If creators grew in between, ER per follower is slightly understated. To test this, we repeated the analysis on 19,918 TikTok creators whose posts and follower counts were collected close together. The shape is the same and slightly steeper: nano 0.77%, micro 0.36%, mid 0.16%, Spearman -0.33.
One more limit: only 196 TikTok creators in the sample have fewer than 5,000 followers, so the TikTok nano tier is in practice a 5k-10k tier.
Per view, TikTok engagement is flat
Measured per view instead of per follower, TikTok engagement does not fall with size. Viewers like, comment on or share 6.3% of views for nano creators, 6.5% for mid-tier creators and 7.7% for mega creators (all countries, n=78,293; Spain 6.08%, n=36,551). What falls with size is views per follower: a nano creator's video gets views equal to about 8.0% of their followers, a mid-tier creator's about 2.9%. People who watch react the same way; fewer followers watch. For how to brief and price TikTok work around this, see the brand guide to TikTok creator campaigns in Spain.
Instagram vs TikTok: how do the two curves compare?
On one log-scale axis, the Instagram curve is flat and noisy between about 0.65% and 1.4%, and the TikTok curve falls from 0.58% at 5k-10k followers to 0.15% at 100k-250k before it levels off. The figure uses 11 follower bins instead of five tiers, so you can see where the TikTok decline happens.
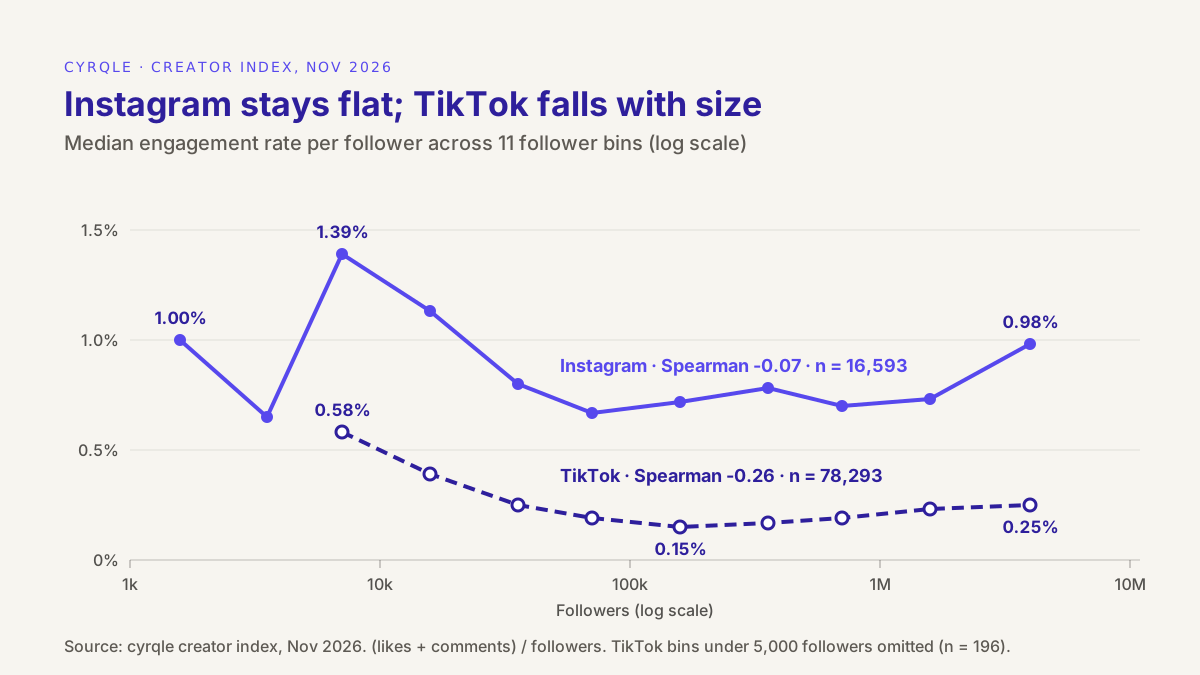
Three reading notes:
- Do not over-read single Instagram bins. The Instagram line is jagged at the small end (0.65% at 2.5k-5k, 1.39% at 5k-10k with n=513). The overall shape is flat.
- Do not read the gap in levels as "TikTok is worse". The two platforms distribute content differently. A follow means less on TikTok, so ER per follower is lower by construction.
- The TikTok decline stops at about 250,000 followers. Above that, ER per follower is flat or slightly rising (0.17% to 0.25%).
Why are these numbers lower than most engagement benchmarks?
Most published engagement benchmarks are 2 to 5 times higher than ours for four reasons: they average instead of taking medians, they divide by reach or views instead of followers, they count saves and shares, or they measure brand accounts instead of creators. None of these is wrong, but a benchmark is only useful if it was computed the way you compute your own number.
Average vs median
An average across posts is pulled up by a few viral posts. An average across accounts is pulled up by a few very high-engagement accounts. In our Instagram nano tier, the p75 is 2.90% and the p90 to p10 ratio is 77x, so an average would land well above the 0.89% median.
Followers vs reach vs views
Instagram's in-app insights report reach (unique accounts that saw a post) and, since 2024, views as the main metric across formats (Tubefilter on the Views change). An ER per reach is higher than an ER per follower whenever a post reaches fewer people than the account has followers, which is common. On TikTok the effect is bigger: Click Analytic reports a TikTok "ER" of 6.87% for Spanish creators with 10k-50k followers without stating the formula. That value matches our engagement per view (6.09% for Spanish micro creators), not our ER per follower (0.37%). Same platform, a difference of almost 20x from the denominator alone.
What counts as engagement
Some tools add saves, shares and replies to likes and comments. That raises the number and makes it impossible to compute from public data, because saves are not public on Instagram. Our ER uses likes and comments only, on both platforms. The one exception is TikTok engagement per view, which also counts shares.
Brands vs creators
Benchmarks from social analytics tools often measure brand accounts. Rival IQ, for example, publishes median engagement for selected companies by industry (Rival IQ benchmark reports). Brand pages are a different population from creators, so use them to judge brand accounts, not to judge creators.
| Population and sample | Statistic | Denominator | Nano value | |
|---|---|---|---|---|
| This report (cyrqle) | Creators, 16,593, n in every cell | Median of medians, with p25-p75 | Followers | 0.89% (1k-10k) |
| SociaVault (2026) | "50,000+ accounts", no n per tier | Average | Followers | 4.2% |
| Colorlib, citing HypeAuditor 2025 | Influencers, sample not stated | Not stated | Not stated | 4-5% (1k-5k) |
| Buffer, as cited by CreatorFlow | About 273,000 accounts | Not stated | Views | Not comparable (per view) |
| Click Analytic, Spain (Aug 2026) | 108,392 accounts with 10k+ followers | Median | Not published | Nano not measured |
Checked on 4 November 2026 against each source's public page: SociaVault, Colorlib, CreatorFlow, Click Analytic.
Use a vendor benchmark when you compute the same way the vendor does, for example an in-app reach-based ER from a creator's own insights. Use this report when you compute ER from public data for a creator you have not hired yet. Click Analytic is the closest match to our method and its Spain numbers agree with ours.
How should you use engagement benchmarks to pick creators?
Use the benchmark for the creator's own tier, platform and country, and read where they sit in the quartiles rather than whether they beat a single number. On Instagram, choose within the tier: the gap between a good and a weak creator in the same tier is much bigger than the gap between tiers.
Compare a creator with the median of their tier
A Spanish micro creator on Instagram with 0.89% is exactly typical (n=946). Above 2.01% puts them in the top quarter of Spanish micro creators; below 0.47%, in the bottom quarter. Set that against the 2% to 5% averages many vendor guides quote, and the same creator looks weak when they are not.
Engagement rate = (median likes + median comments) / followers. Compare the result with the median for the creator's tier.
Likes, comments and followers are illustrative. The tier median comes from the cyrqle creator index, Nov 2026.
Worked example (illustrative creator): an Instagram micro creator with 21,000 followers, a median of 180 likes and 12 comments per post. ER = (180 + 12) / 21,000 = 0.91%. That is 1.03x the micro median of 0.89%: a typical creator for the tier, well short of the top-quarter mark of 2.37% (all countries). Before you shortlist, run each creator through the influencer vetting and brand-safety checklist: engagement is one line on it, not the whole check.
Read the spread, not just the median
The spread inside a tier is large. On Instagram, a creator at the 75th percentile of their tier engages 7x to 11x more than one at the 25th percentile, and the top 10% engage 56x to 77x more than the bottom 10%. Two micro creators can both have 20,000 followers and differ by an order of magnitude. That is why picking the tier is the smaller decision. Our post on why audience clusters say more than follower count makes the case for fit over size. The next report in this series looks at the spread in detail.
On TikTok, judge by views and engagement per view
Because TikTok ER per follower falls with size by construction, a mid-tier TikTok creator at 0.20% is typical, not weak. Look at median views per video and engagement per view (about 6% for the median Spanish creator). For pricing, divide the fee by expected views: the guide on choosing creators by views and CPM shows how.
Pair engagement with cost
Engagement rate is a content health signal, not a sales signal. A creator with high ER and a high fee can be worse value than a typical creator with a fair fee. Put the two together: the 2026 influencer rates for Spain give illustrative fee bands by tier, and effective CPM turns any quote into a cost per thousand views.
What are the limits of this data?
- One extraction. All cells come from one read of the index on 4 November 2026. They describe the sample, not every creator on each platform.
- Profile country. Only 46% of Instagram creators in the sample have a profile country (95% on TikTok). Creators without one appear only in the "All countries" column.
- TikTok timing. Most TikTok posts are from January to June 2024; the aligned check above gives the same shape.
- TikTok nano is effectively 5k-10k.
- Feed posts only. No Instagram Stories, no YouTube, no other platforms.
- Thin LatAm cells. Colombia and Argentina have few cells above 50 creators; use the "All tiers" rows.
- Public numbers only. Likes and comments as shown publicly; no saves, shares or reach.
How cyrqle helps
In Find creators, the Explore tab filters the index by country, sector, engagement and more with a rule builder. Each creator profile shows computed engagement, posting cadence, content mix and brand-collaboration history (paid partnerships and tagged brands), so you can compare a creator with the tier medians in this report before you contact them. Country here is the profile country, as in this report.
To rank a shortlist against a campaign, brief match scores creators against your brief, and lenses such as best value, viral upside and hidden gems reorder the results. cyrqle ranks; you choose and invite. When you group creators into a cluster, the Planner shows a live reach and cost estimate for the group. Every reach and cost figure is an estimate built from public post data, not a quote.
To see the benchmarks applied to your category and markets, book a 30-minute demo.
More in this series
This report is the pillar for the 2026 creator benchmarks series. Each follow-up piece uses the same sample and method.
For market-level context (spend, adoption, platform use), see our creator economy statistics for 2026.
How to cite this data
You may quote any cell in this report with its n and this citation:
"cyrqle analysis of 16,593 public Instagram and 78,293 public TikTok creator profiles (977,000 posts, Jan 2024 to Nov 2026), Nov 2026."
For a chart footer: "Source: cyrqle creator index, Nov 2026, n = [cell n]." The data is aggregated; no creator is identified.
FAQ
What is the average engagement rate in Spain?
On Instagram, the median Spanish creator gets 0.89% per post (n=3,042), slightly above the global median of 0.82%. On TikTok it is 0.37% per follower (n=36,551) and about 6.1% per view. These are medians, not averages, so they sit below many published benchmarks.
What is a good engagement rate on Instagram for 10k followers?
For a creator with 10,000 to 50,000 followers, the median Instagram engagement rate is 0.89% per post (n=2,905). Above 2.37% puts them in the top quarter of the tier, below 0.32% in the bottom quarter. In Spain the median is also 0.89% (n=946), with the top quarter starting at 2.01%.
Do smaller creators have higher engagement rates?
On TikTok, yes: per follower, nano creators get 0.58% and mid-tier creators 0.17% (n=78,293). On Instagram, barely: nano creators get 0.89% and mega creators 0.86%, a rank correlation of -0.07 (n=16,593). On Instagram the difference between creators in the same tier matters far more than the tier.
What is a good engagement rate on TikTok?
It depends on the denominator. Per follower, the median TikTok creator gets 0.30% per post (n=78,293), and 0.37% in Spain (n=36,551). Per view, the median is about 6.5%. Check which one a benchmark uses before you compare: the two differ by about 20x.
Why is my engagement rate lower than the benchmarks I see online?
Most online benchmarks are averages, use reach or views as the denominator, or add saves and shares. A few viral posts lift an average a lot. This report uses the median creator's median post per follower, so it is the right comparison for an ER you compute from public likes and comments.
Is Mexico's engagement rate lower than Spain's?
On Instagram, yes in every tier we can publish: 0.60% for all Mexican creators (n=642) against 0.89% for Spanish creators (n=3,042). On TikTok the two are close, 0.33% for Mexico (n=1,202) and 0.37% for Spain (n=36,551). Country is the creator's profile country, not where the audience lives.
Sources
- cyrqle creator index, data extracted 4 November 2026 (method above).
- Click Analytic, Creator Economy Report Spain: https://www.clickanalytic.com/es/creator-economy-report/spain/
- Click Analytic, Creator Economy Report Mexico: https://www.clickanalytic.com/creator-economy-report/mexico/
- Tubefilter, Instagram makes Views the primary metric (August 2024): https://www.tubefilter.com/2024/08/07/instagram-views-reels-posts-multi-format-adam-mosseri/
- Rival IQ benchmark reports: https://www.rivaliq.com/benchmark-reports/
- SociaVault, good engagement rate on Instagram: https://sociavault.com/blog/good-engagement-rate-instagram
- Colorlib, Instagram engagement rate statistics: https://colorlib.com/wp/instagram-engagement-rate/
- CreatorFlow, Instagram engagement rate: https://creatorflow.so/blog/instagram-engagement-rate
Related field notes.
Followers tell you how many people once pressed a button. Views tell you how many people see a post today. How to compare creators on median views, effective CPM and consistency, with a worked example.
A practical method for benchmarking your brand against competitors on Instagram and TikTok: posting cadence, engagement, content mix, hashtags and, most usefully, which creators talk about them.
How do brands find influencers? They search by topic, then check five signals on your profile. What brand teams look at, and how creators can get found.